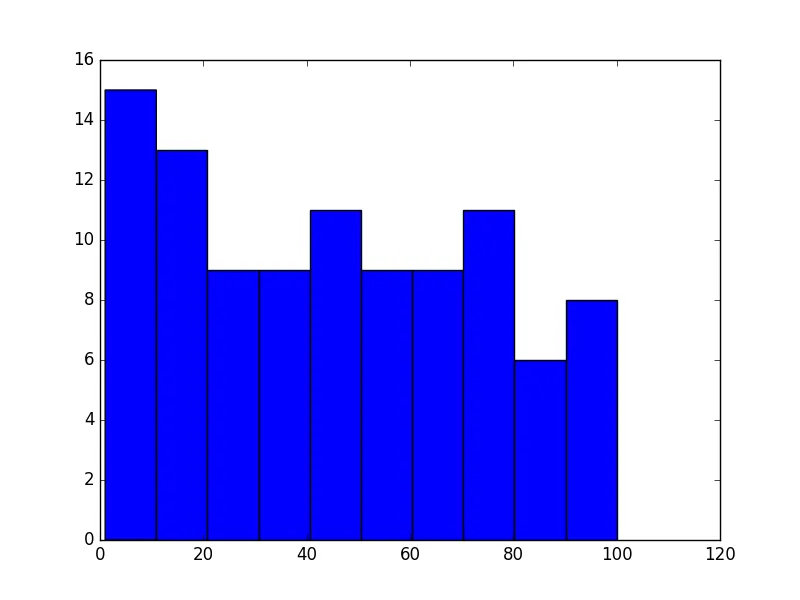
我用以下代码生成了100个1到100之间的随机数:
def histogram():
    for x in range(100):
        x = random.randint(1, 100)
        print(x)
现在我正试图用直方图来表示这些信息,我导入了matplotlib.pyplot作为plt并尝试构建直方图,但好像遇到了问题。
我尝试过:
def histogram():
    for x in range(100):
        x = random.randint(1, 100)
        return x
    histogram_plot = histogram()
    plt.hist(histogram_plot)
    plt.show()
我也尝试过:
def histogram():
    for x in range(100):
        x = random.randint(1, 100)
        print(x)
        plt.hist(x)
        plt.show()
我做错了什么?
return意味着函数将在循环的一次迭代后返回。你真的不想这样做! - PM 2Ring