我正在使用Matplotlib可视化三维数组。除了一个小问题,我已经接近自己想要的效果......请看下面的插图和描述,了解我能够实现什么以及我想要它做什么......
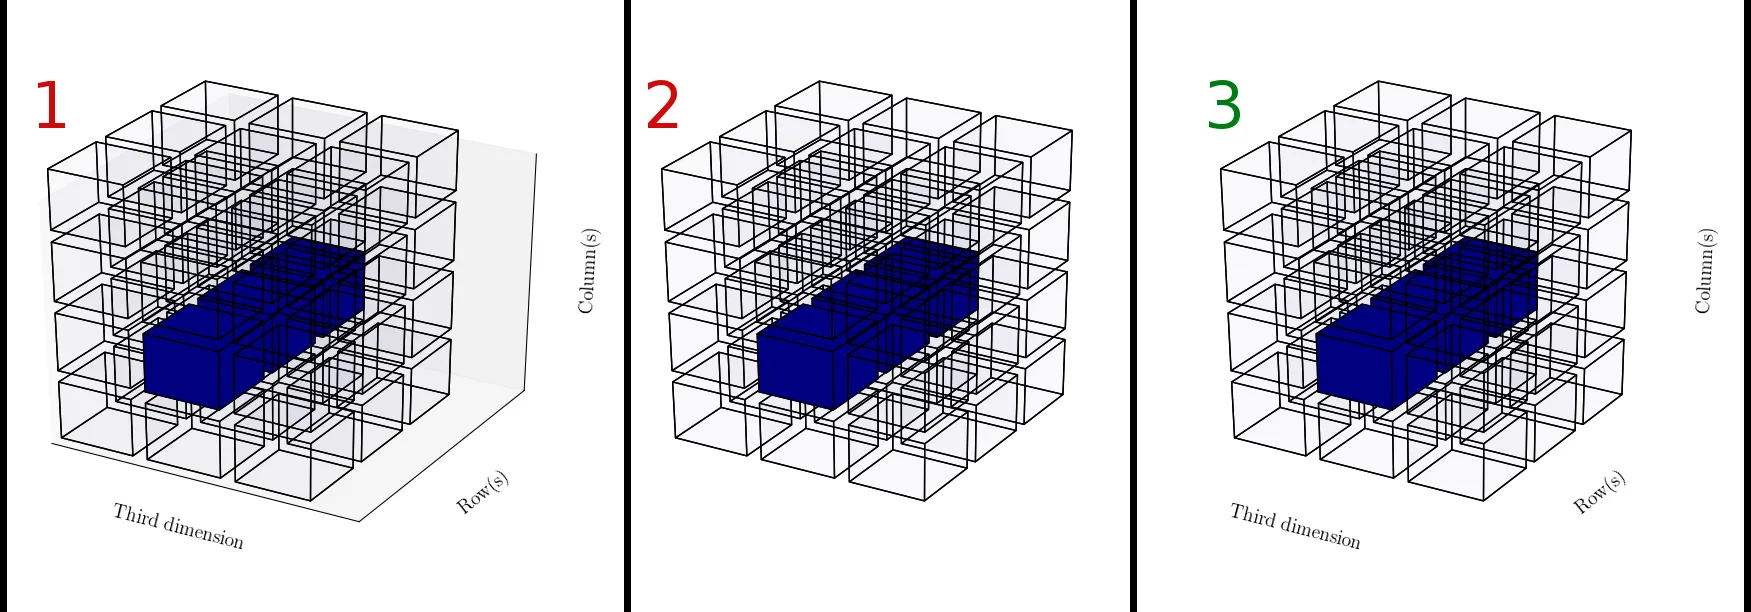
- 显示一堆带标签的立方体,但还有其他东西。
- 显示一堆立方体,但没有轴标签。
- 这就是我想要的,但我无法做到......我想展示一堆带轴标签的立方体,但没有其他东西。
希望你们可以帮帮我:) 请参见下面的源代码。
from mpl_toolkits.mplot3d import axes3d
import matplotlib.pyplot as plt
from matplotlib import rcParams
import numpy as np
rcParams['axes.labelsize'] = 14
rcParams['axes.titlesize'] = 16
rcParams['xtick.labelsize'] = 14
rcParams['ytick.labelsize'] = 14
rcParams['legend.fontsize'] = 14
rcParams['font.family'] = 'serif'
rcParams['font.serif'] = ['Computer Modern Roman']
rcParams['text.usetex'] = True
rcParams['grid.alpha'] = 0.0

def make_cube():
    """ A Cube consists of a bunch of planes..."""

    planes = {
        "top"    : ( [[0,1],[0,1]], [[0,0],[1,1]], [[1,1],[1,1]] ),
        "bottom" : ( [[0,1],[0,1]], [[0,0],[1,1]], [[0,0],[0,0]] ),
        "left"   : ( [[0,0],[0,0]], [[0,1],[0,1]], [[0,0],[1,1]] ),
        "right"  : ( [[1,1],[1,1]], [[0,1],[0,1]], [[0,0],[1,1]] ),
        "front"  : ( [[0,1],[0,1]], [[0,0],[0,0]], [[0,0],[1,1]] ),
        "back"   : ( [[0,1],[0,1]], [[1,1],[1,1]], [[0,0],[1,1]] )
    }
    return planes

def render_array(ary, highlight):
    fig = plt.figure()
    ax = fig.add_subplot(111, projection='3d')

    cube = make_cube()

    for space in xrange(0, ary.shape[0]):
        for column in xrange(0, ary.shape[1]):
            for row in xrange(0, ary.shape[2]):
                alpha = 0.01
                if highlight[space,column,row] == 1:
                    alpha = 1
                for side in cube:
                    (Xs, Ys, Zs) = (
                        np.asarray(cube[side][0])+space+space*0.2,
                        np.asarray(cube[side][2])+row+row*0.2,
                        np.asarray(cube[side][3])+column+column*0.2
                    )
                    ax.plot_surface(Xs, Ys, Zs, rstride=1, cstride=1, alpha=alpha)

    highest = 0                         # Make it look cubic
    for size in ary.shape:
        if size > highest:
            highest = size
    ax.set_xlim((0,highest))
    ax.set_ylim((0,highest))
    ax.set_zlim((0,highest))


    ax.set_xlabel('Third dimension' )   # Meant to visualize ROW-MAJOR ordering
    ax.set_ylabel('Row(s)')
    ax.set_zlabel('Column(s)')

    #plt.axis('off')    # This also removes the axis labels... i want those...
    #ax.set_axis_off()  # this removes too much (also the labels)

    # So I try this instead...
    ax.set_xticks([])          # removes the ticks... great now the rest of it
    ax.set_yticks([])
    ax.set_zticks([])
    #ax.grid(False)             # this does nothing....
    #ax.set_frame_on(False)     # this does nothing....
    plt.show()

def main():

    subject = np.ones((3,4,3))

    highlight = np.zeros(subject.shape) # Highlight a row
    highlight[1,1,:] = 1

    render_array(subject, highlight)    # Show it

if __name__ == "__main__":
    main()
更新, 感谢回答,这是我所缺少的内容:
# Get rid of the panes
ax.w_xaxis.set_pane_color((1.0, 1.0, 1.0, 0.0))
ax.w_yaxis.set_pane_color((1.0, 1.0, 1.0, 0.0))
ax.w_zaxis.set_pane_color((1.0, 1.0, 1.0, 0.0))

# Get rid of the spines
ax.w_xaxis.line.set_color((1.0, 1.0, 1.0, 0.0))
ax.w_yaxis.line.set_color((1.0, 1.0, 1.0, 0.0))
ax.w_zaxis.line.set_color((1.0, 1.0, 1.0, 0.0))
这将与以下内容一起:
# Get rid of the ticks
ax.set_xticks([])
ax.set_yticks([])
ax.set_zticks([])
仅显示标签,如图3所示。
更新
我已经清理并使代码可用,并在此处提供: https://github.com/safl/ndarray_plot
同时还提供了几个其他示例: http://nbviewer.ipython.org/github/safl/ndarray_plot/blob/master/nb/ndap.ipynb