我有一组点的文本文件: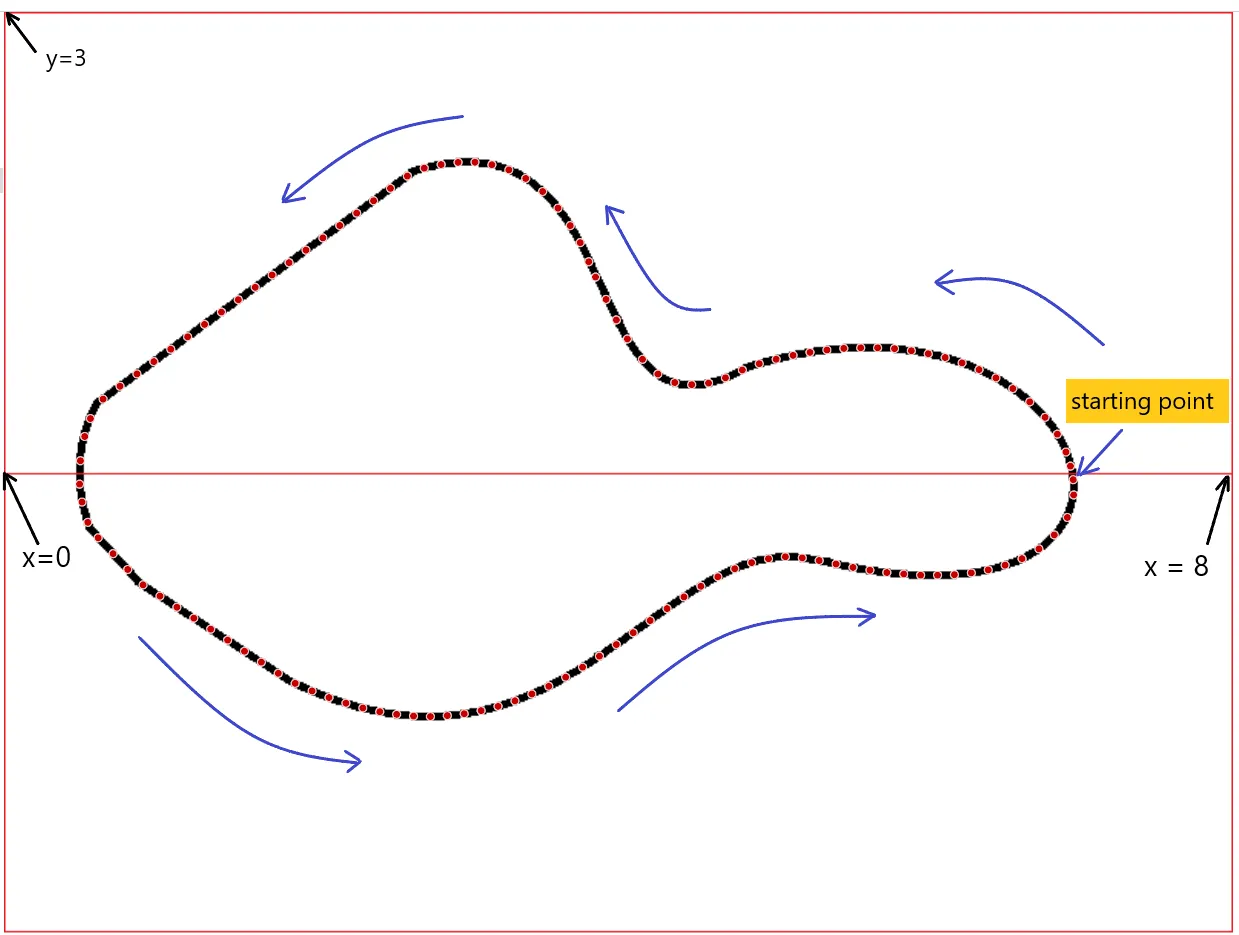 我尝试使用极坐标来实现:我计算每个点
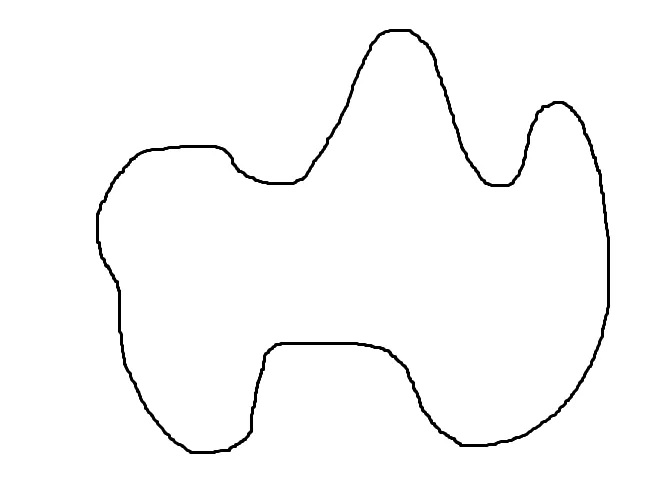
random_shape.dat。文件中点的初始顺序是随机的。我想按照逆时针顺序对这些点进行排序,如下所示(红点是xy数据):
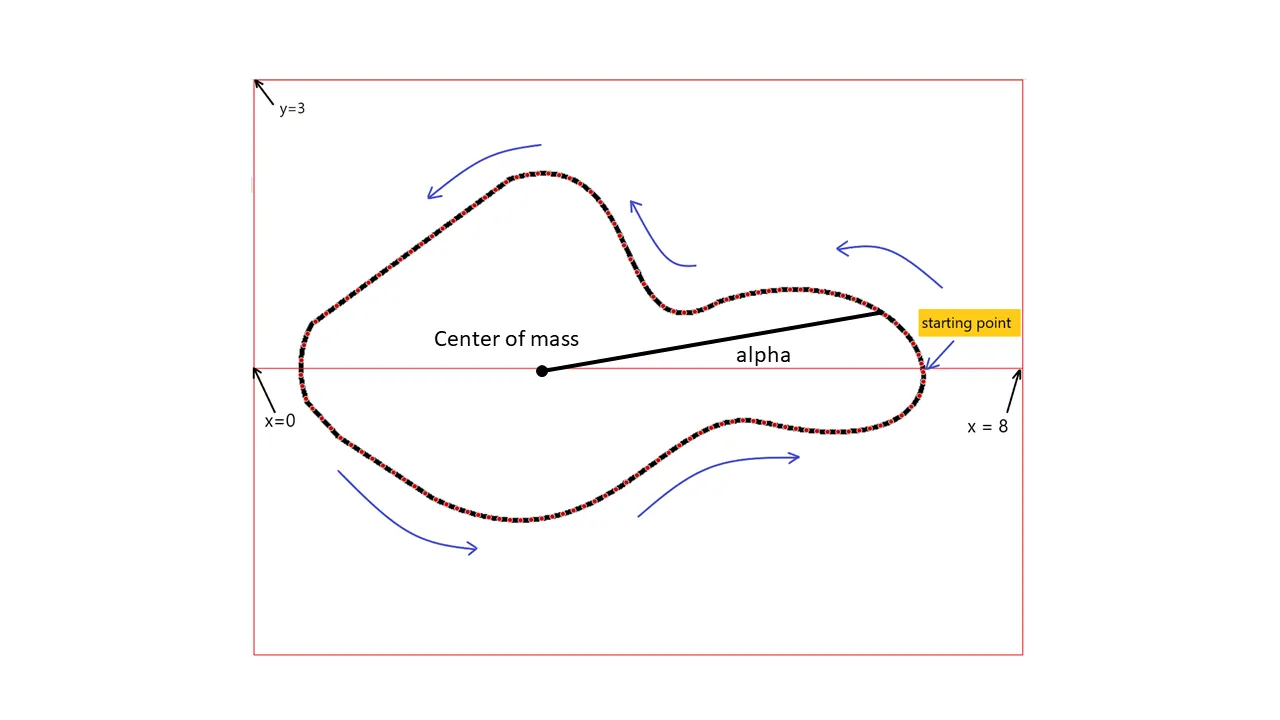
我尝试使用极坐标来实现:我计算每个点(x,y)的极角,然后按升序排列,如下所示:"""
Script: format_file.py
Description: This script will format the xy data file accordingly to be used with a program expecting CCW order of data points, By soting the points in Counterclockwise order
Example: python format_file.py random_shape.dat
"""
import sys
import numpy as np
# Read the file name
filename = sys.argv[1]
# Get the header name from the first line of the file (without the newline character)
with open(filename, 'r') as f:
header = f.readline().rstrip('\n')
angles = []
# Read the data from the file
x, y = np.loadtxt(filename, skiprows=1, unpack=True)
for xi, yi in zip(x, y):
angle = np.arctan2(yi, xi)
if angle < 0:
angle += 2*np.pi # map the angle to 0,2pi interval
angles.append(angle)
# create a numpy array
angles = np.array(angles)
# Get the arguments of sorted 'angles' array
angles_argsort = np.argsort(angles)
# Sort x and y
new_x = x[angles_argsort]
new_y = y[angles_argsort]
print("Length of new x:", len(new_x))
print("Length of new y:", len(new_y))
with open(filename.split('.')[0] + '_formatted.dat', 'w') as f:
print(header, file=f)
for xi, yi in zip(new_x, new_y):
print(xi, yi, file=f)
print("Done!")
通过运行脚本:
python format_file.py random_shape.dat
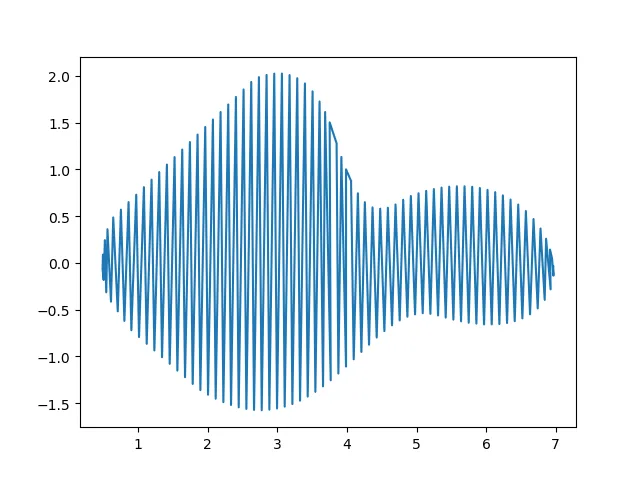
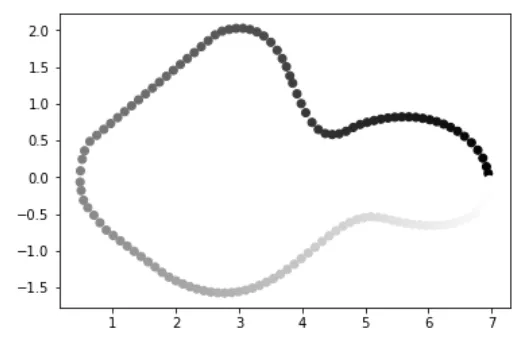
很不幸,我在random_shape_formated.dat中没有得到预期的结果!点没有按所需顺序排序。
感谢任何帮助。
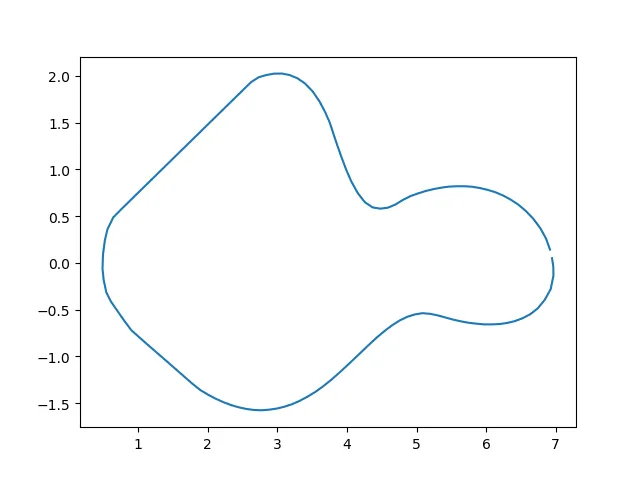
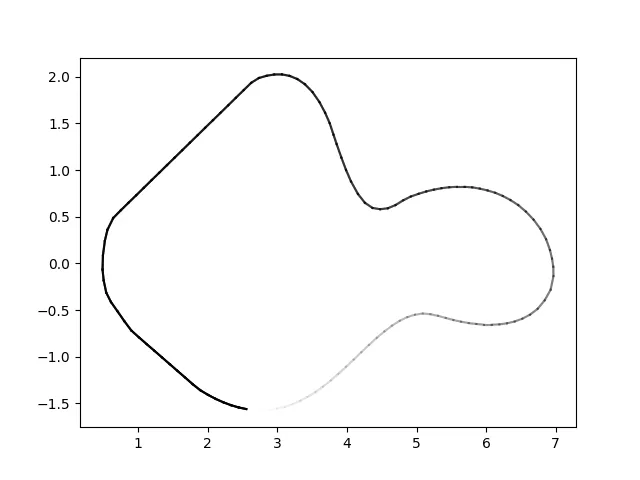
编辑: 期望的结果如下:
- 创建一个名为:
filename_formatted.dat的新文件,其中包含根据上图排序的数据(第一行包含起始点,接下来的行包含蓝色箭头所示的点,方向为逆时针)。
编辑2: 此处添加了xy数据,而不是使用github gist:
random_shape
0.4919261070361315  0.0861956168831175
0.4860816807027076  -0.06601587301587264
0.5023029456281289  -0.18238249845392662
0.5194784026079869  0.24347943722943777
0.5395164357511545  -0.3140611471861465
0.5570497147514262  0.36010146103896146
0.6074231036252226  -0.4142604617604615
0.6397066014669927  0.48590810704447085
0.7048302091822873  -0.5173701298701294
0.7499157837544145  0.5698170011806378
0.8000108666123336  -0.6199254449254443
0.8601249660418364  0.6500974025974031
0.9002010323281716  -0.7196585989767801
0.9703341483292582  0.7299242424242429
1.0104102146155935  -0.7931355765446666
1.0805433306166803  0.8102046438410078
1.1206193969030154  -0.865251869342778
1.1907525129041021  0.8909386068476981
1.2308285791904374  -0.9360074773711129
1.300961695191524  0.971219008264463
1.3410377614778592  -1.0076702085792988
1.4111708774789458  1.051499409681228
1.451246943765281  -1.0788793781975592
1.5213800597663678  1.1317798110979933
1.561456126052703  -1.1509956709956706
1.6315892420537896  1.2120602125147582
1.671665308340125  -1.221751279024005
1.7417984243412115  1.2923406139315234
1.7818744906275468  -1.2943211334120424
1.8520076066286335  1.3726210153482883
1.8920836729149686  -1.3596340023612745
1.9622167889160553  1.4533549783549786
2.0022928552023904  -1.4086186540731989
2.072425971203477  1.5331818181818184
2.1125020374898122  -1.451707005116095
2.182635153490899  1.6134622195985833
2.2227112197772345  -1.4884454939000387
2.292844335778321  1.6937426210153486
2.3329204020646563  -1.5192876820149541
2.403053518065743  1.774476584022039
2.443129584352078  -1.5433264462809912
2.513262700353165  1.8547569854388037
2.5533387666395  -1.561015348288075
2.6234718826405867  1.9345838252656438
2.663547948926922  -1.5719008264462806
2.7336810649280086  1.9858362849271942
2.7737571312143436  -1.5750757575757568
2.8438902472154304  2.009421487603306
2.883966313501766  -1.5687258953168035
2.954099429502852  2.023481896890988
2.9941754957891877  -1.5564797323888229
3.0643086117902745  2.0243890200708385
3.1043846780766096  -1.536523022432113
3.1745177940776963  2.0085143644234558
3.2145938603640314  -1.5088557654466737
3.284726976365118  1.9749508067689887
3.324803042651453  -1.472570838252656
3.39493615865254  1.919162731208186
3.435012224938875  -1.4285753640299088
3.5051453409399618  1.8343467138921687
3.545221407226297  -1.3786835891381335
3.6053355066557997  1.7260966810966811
3.655430589513719  -1.3197205824478546
3.6854876392284703  1.6130086580086582
3.765639771801141  -1.2544077134986225
3.750611246943765  1.5024152236652237
3.805715838087476  1.3785173160173163
3.850244800627849  1.2787337662337666
3.875848954088563  -1.1827449822904361
3.919007794704616  1.1336638361638363
3.9860581363759846  -1.1074537583628485
3.9860581363759846  1.0004485329485333
4.058012891753723  0.876878197560016
4.096267318663407  -1.0303482880755608
4.15638141809291  0.7443374218374221
4.206476500950829  -0.9514285714285711
4.256571583808748  0.6491902794175526
4.3166856832382505  -0.8738695395513574
4.36678076609617  0.593855765446675
4.426894865525672  -0.7981247540338443
4.476989948383592  0.5802489177489183
4.537104047813094  -0.72918339236521
4.587199130671014  0.5902272727272733
4.647313230100516  -0.667045454545454
4.697408312958435  0.6246979535615904
4.757522412387939  -0.6148858717040526
4.807617495245857  0.6754968516332154
4.8677315946753605  -0.5754260133805582
4.917826677533279  0.7163173947264858
4.977940776962782  -0.5500265643447455
5.028035859820701  0.7448917748917752
5.088149959250204  -0.5373268398268394
5.138245042108123  0.7702912239275879
5.198359141537626  -0.5445838252656432
5.2484542243955445  0.7897943722943728
5.308568323825048  -0.5618191656828015
5.358663406682967  0.8052154663518301
5.41877750611247  -0.5844972451790631
5.468872588970389  0.8156473829201105
5.5289866883998915  -0.6067217630853987
5.579081771257811  0.8197294372294377
5.639195870687313  -0.6248642266824076
5.689290953545233  0.8197294372294377
5.749405052974735  -0.6398317591499403
5.799500135832655  0.8142866981503349
5.859614235262157  -0.6493565525383702
5.909709318120076  0.8006798504525783
5.969823417549579  -0.6570670995670991
6.019918500407498  0.7811767020857934
6.080032599837001  -0.6570670995670991
6.13012768269492  0.7562308146399057
6.190241782124423  -0.653438606847697
6.240336864982342  0.7217601338055886
6.300450964411845  -0.6420995670995664
6.350546047269764  0.6777646595828419
6.410660146699267  -0.6225964187327819
6.4607552295571855  0.6242443919716649
6.520869328986689  -0.5922077922077915
6.570964411844607  0.5548494687131056
6.631078511274111  -0.5495730027548205
6.681173594132029  0.4686727666273125
6.7412876935615325  -0.4860743801652889
6.781363759847868  0.3679316979316982
6.84147785927737  -0.39541245791245716
6.861515892420538  0.25880333951762546
6.926639500135833  -0.28237987012986965
6.917336127605076  0.14262677798392165
6.946677533279001  0.05098957832291173
6.967431210462995  -0.13605442176870675
6.965045730326905  -0.03674603174603108