如何使绘图标题部分加粗?

10

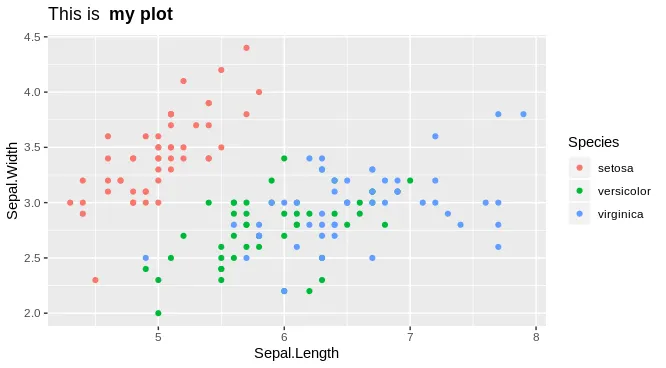
我想编辑我的图表标题,使其有四个单词,只有最后两个单词是粗体的,例如:标题:"This is"(普通字体)"my plot"(粗体)。

我尝试了几种在网上找到的代码,但只能使整个图表标题变为粗体。我的代码(示例)看起来像这样,因为我还想更改标题的颜色和位置。现在由于我的代码中有“face=bold”,所以整个标题都是粗体。如上所述,我只想让最后两个单词是粗体的,即一行内,没有子标题或下面的另一行。我正在使用ggplot2,非常感谢帮助!

plot4 <- plot4 + labs(title = "This is my plot")

plot4 <- plot4 + theme(plot.title=element_text(hjust=0.5, vjust=0.1, face='bold', colour="blue"))

2
请查看 https://cran.r-project.org/web/packages/latex2exp/vignettes/using-latex2exp.html。 - Christoph
@Christoph 如果基于 latex2exp 包的答案对其他人有用,您愿意发表一篇吗? - Rui Barradas
非常相关的内容 https://dev59.com/PlwY5IYBdhLWcg3wgH7y?answertab=trending#tab-top - tjebo
2个回答

7

使用plotmath,参考R文档ggplot2维基

library(ggplot2)

p <- ggplot(iris, aes(Sepal.Length, Sepal.Width, colour = Species)) +
  geom_point()

p + labs(title = bquote('This is' ~ bold('my plot')))

enter image description here


如果粗体部分在前,非粗体部分在后,您要如何设置? - canderson156
@canderson156 这个 bquote('This is' ~ bold('my plot') ~ 'revised') 的回答是否正确? - Rui Barradas
我在想哪个是正确的:bquote( ~bold('This is') ~ 'my plot') 还是 bquote( bold('This is') ~ 'my plot')。 - canderson156
@canderson156 后者,bquote( bold('This is') ~ 'my plot')。波浪线在两个字符串之间加入空格,在这种情况下(以及一般情况下),这是您所希望的。而且,2、3等波浪线将在字符串之间放置更大的空格,可以尝试使用p + labs(title = bquote(bold('my plot') ~~~ "revised")) - Rui Barradas

4

您也可以使用latex2exp包:

library(ggplot2)
p <- ggplot(iris, aes(Sepal.Length, Sepal.Width, colour = Species)) +
  geom_point()
p + labs(title = latex2exp::TeX("$\\alpha = 5$ text, then \\textbf{bold}"))

或者

plot(0, 0, main = latex2exp::TeX("$\\alpha = 5$ text, then \\textbf{bold}"))

具有相同效果但更灵活。


非常好!对于像我这样的LaTeX用户来说,我总是不得不去查阅plotmath文档,即使这样也可能需要一段时间才能搞清楚。 - Rui Barradas
这是我在将“粗体字符串”作为变量传递时使用的唯一解决方案。例如,在绘制多个图形并且您想要将标题的一部分加粗以突出显示更改部分的函数内部。 - kael
@ahorn 现在我明白了 - 我没有看第一行,因为示例是正确的... 顺便说一下:在这种情况下,您可以编辑问题/答案 ;-) - Christoph

网页内容由stack overflow 提供, 点击上面的
可以查看英文原文,
原文链接