我正在尝试使用bokeh在python中创建图表,以允许对数据进行动态可视化。值得注意的是,我相对较新于python,非常新于bokeh,而且我不懂javascript。我已经参考了这个链接:在Python中使用Bokeh将Span或Cursor链接到不同的图表和这个链接:
Python 3.5.2 - Bokeh 12.0
http://docs.bokeh.org/en/latest/docs/user_guide/interaction/callbacks.html
但我在实现每个必要部分时遇到了麻烦。在添加所需功能之前,这是我的代码:
from bokeh.layouts import column, widgetbox
from bokeh.models.widgets import Slider
from bokeh.models import Span, CustomJS

output_file('Raw_Spectra_and_Spillover_Data.html')

# widgets for bin setup
Pix1_LowLow = Slider(start = self.StartDAC, end = self.EndDAC, value = 129, step = 1, title = 'Pixel-1 - Low Bin - Low Thresh')
Pix1_LowHigh = Slider(start = self.StartDAC, end = self.EndDAC, value = 204, step = 1, title = 'Pixel-1 - Low Bin - High Thresh')
Pix1_HighLow = Slider(start = self.StartDAC, end = self.EndDAC, value = 218, step = 1, title = 'Pixel-1 - High Bin - Low Thresh')
Pix1_HighHigh = Slider(start = self.StartDAC, end = self.EndDAC, value = 500, step = 1, title = 'Pixel-1 - High Bin - High Thresh')

plot1spect = figure(width=700, height=250, title='pixel-1 Spectrum')
plot1spect.line(self.SpectDACvals1[0], self.SpectrumData1[0], line_width=2)
plot1spect_LowLowSpan = Span(location=Pix1_LowLow.value, dimension = 'height')
plot1spect_LowHighSpan = Span(location=Pix1_LowHigh.value, dimension = 'height')
plot1spect_HighLowSpan = Span(location=Pix1_HighLow.value, dimension = 'height')
plot1spect_HighHighSpan = Span(location=Pix1_HighHigh.value, dimension = 'height')
plot1spect.renderers.extend([plot1spect_LowLowSpan, plot1spect_LowHighSpan, plot1spect_HighLowSpan, plot1spect_HighHighSpan])

plot1spill = figure(width=700, height=250, title='pixel-1 Spillover')
plot1spill.line(self.SpillDACvals1[0], self.SpillData1[0], line_width=2)
plot1spill_LowLowSpan = Span(location=Pix1_LowLow.value, dimension = 'height')
plot1spill_LowHighSpan = Span(location=Pix1_LowHigh.value, dimension = 'height')
plot1spill_HighLowSpan = Span(location=Pix1_HighLow.value, dimension = 'height')
plot1spill_HighHighSpan = Span(location=Pix1_HighHigh.value, dimension = 'height')
plot1spill.renderers.extend([plot1spill_LowLowSpan, plot1spill_LowHighSpan, plot1spill_HighLowSpan, plot1spill_HighHighSpan])

show(row(plot1spect,plot1spill, widgetbox(Pix1_LowLow, Pix1_LowHigh, Pix1_HighLow, Pix1_HighHigh)))
这段代码给我这个:
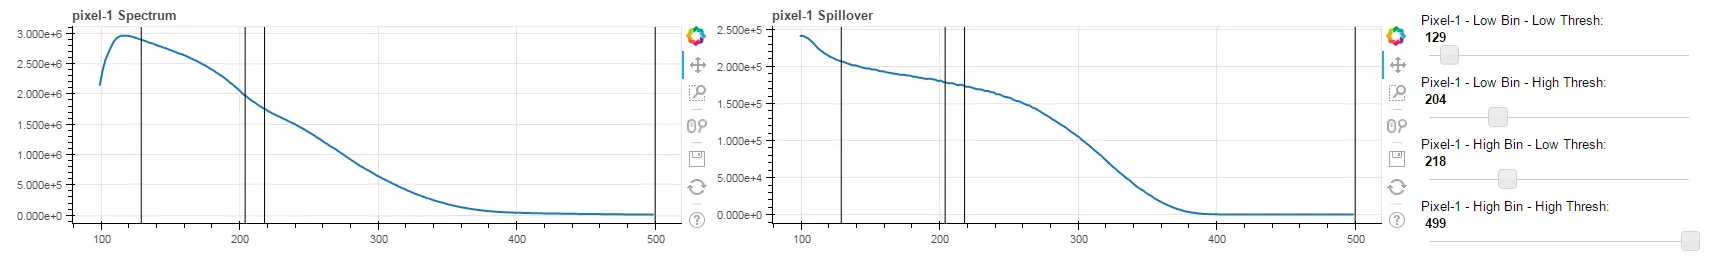
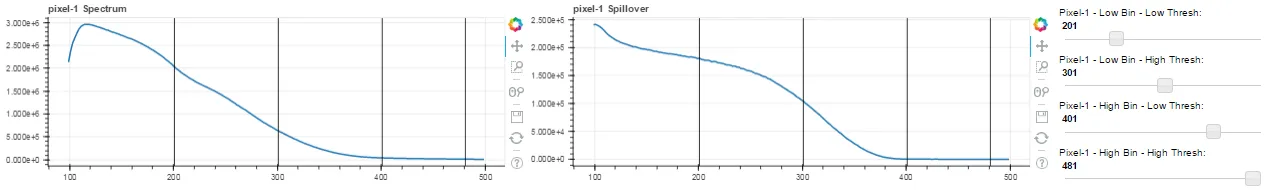
Pix1_LowLow 滑块动态控制 plot1spect_LowLowSpan 的位置,那么我就可以将这种技术扩展到其他滑块和范围中。非常感谢!Python 3.5.2 - Bokeh 12.0
反引号插入行内代码。请说明您的 Python 版本。 - buhtz