我的绘图(使用xyplot和lattice)如下: 它看起来相当不错,但我该如何控制灰色面板框的高度呢? 我尝试了以下方法: strip=strip.custom( par.strip.text=list(cex=2,lines=5,lineheight=2)) 但是这并不起作用。
如果您想改变条带高度: library(lattice) Depth <- equal.count(quakes$depth, number=8, overlap=.1) xyplot(lat ~ long | Depth, data = quakes, par.strip = list(lines = 5, cex = 0.5))
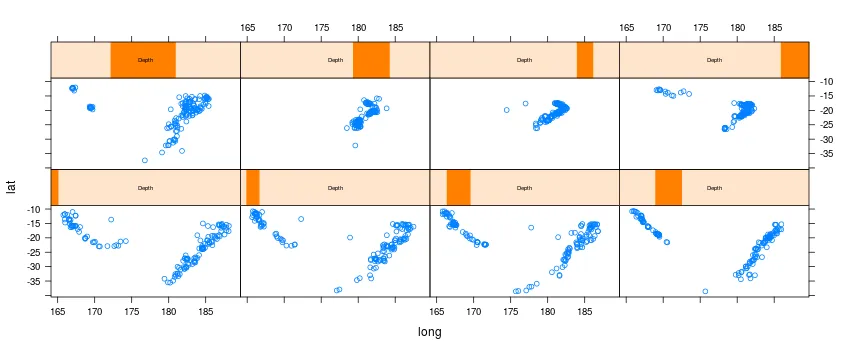
xyplot(..., par.strip = list(lines = 2))。 - user3710546