这只是我的一些测试和个人研究的结果,没有声称完整或专业。请评论或回答谁发现有问题。
当然,您的数据应该按照索引值的正确顺序排列,您可以使用
df.sort_index(inplace = True)来确保它,就像您在答案中所述的那样。这本质上并没有错,尽管错误消息与排序顺序无关,并且我已经检查过了:当我对手头的大型数据集的索引进行排序时,错误并没有消失。当然,我也必须对df.index进行排序,但decompose()也可以处理未排序的数据,其中项目在时间上跳来跳去:然后您只会从左到右看到很多蓝线,直到整个图形充满它。更重要的是,通常情况下,排序已经按正确顺序进行了。在我的情况下,排序无法帮助修复错误。因此,我也怀疑索引排序是否在您的情况下修复了错误,因为:错误实际上是什么?
ValueError:您必须指定:
- [要么]一个周期
- 或x必须是具有未设置为None的DatetimeIndex的pandas对象
首先,在情况下您有一个
列表列,使得您的时间序列到目前为止嵌套了起来,请参见
将具有“列表列”的pandas df转换为长格式中的时间序列。使用三列:[数据列表]+[时间戳]+[持续时间]以获取有关如何取消嵌套
列表列的详细信息。这对于1.)和2.)都是必需的。
1.的详细信息:“您必须指定[要么]一个周期…”
周期的定义
从
https://www.statsmodels.org/stable/generated/statsmodels.tsa.seasonal.seasonal_decompose.html中的“period,int,可选”:
系列的周期。如果x不是pandas对象或x的索引没有频率,则必须使用。如果x是具有时间序列索引的pandas对象,则覆盖x的默认周期性。
使用整数设置的周期参数表示您希望在数据中出现的循环次数。如果您有一个包含1000行和一个列表列(称为df_nested)的df,每个列表例如有100个元素,则每个循环将有100个元素。最好采用
period = len(df_nested)(=循环数)以获得最佳季节性和趋势拆分。如果每个循环的元素随时间变化,则可能有更好的其他值。
“我不确定如何正确设置参数,因此还有一个未回答的问题
statsmodels seasonal_decompose():在列表列上下文中,系列的正确“周期”是什么在Cross Validated上。”
选项1)的“周期”参数比选项2)具有更大的优势。虽然它使用时间索引(DatetimeIndex)作为x轴,但与选项2)相比,它不需要每个项目完全符合频率。相反,它只是将一行中的任何内容连接在一起,这样做的好处是您不需要填补任何间隙:前一个事件的最后一个值只是与以下事件的下一个值连接在一起,无论它是否已经在下一个秒钟或下一天。
最大的“周期”值是多少?如果您有一个列表列(再次将df称为“df_nested”),则应首先将列表列解压缩为普通列。最大周期为
len(df_unnested)/2。
例如1:x中有20个项目(x是df_unnested的所有项目的数量),最大可以有
period = 10。
例如2:有20个项目,并采用
period=20,则会出现以下错误:
ValueError: x must have 2 complete cycles requires 40 observations. x only has 20 observation(s)
另一个副注:
要消除问题中的错误,
period = 1应该已经解决了问题,但对于时间序列分析,“=1”不会揭示任何新信息,每个周期只有1个项目,则趋势与原始数据相同,季节性为0,残差始终为0。
####
示例借鉴自将包含在“列表列”中的数据的pandas df转换为长格式的时间序列。 使用三列:[数据列表] + [时间戳] + [持续时间]
df_test = pd.DataFrame({'timestamp': [1462352000000000000, 1462352100000000000, 1462352200000000000, 1462352300000000000],
                'listData': [[1,2,1,9], [2,2,3,0], [1,3,3,0], [1,1,3,9]],
                'duration_sec': [3.0, 3.0, 3.0, 3.0]})
tdi = pd.DatetimeIndex(df_test.timestamp)
df_test.set_index(tdi, inplace=True)
df_test.drop(columns='timestamp', inplace=True)
df_test.index.name = 'datetimeindex'

df_test = df_test.explode('listData')
sizes = df_test.groupby(level=0)['listData'].transform('size').sub(1)
duration = df_test['duration_sec'].div(sizes)
df_test.index += pd.to_timedelta(df_test.groupby(level=0).cumcount() * duration, unit='s')
得到的 df_test['listData'] 如下所示:
2016-05-04 08:53:20    1
2016-05-04 08:53:21    2
2016-05-04 08:53:22    1
2016-05-04 08:53:23    9
2016-05-04 08:55:00    2
2016-05-04 08:55:01    2
2016-05-04 08:55:02    3
2016-05-04 08:55:03    0
2016-05-04 08:56:40    1
2016-05-04 08:56:41    3
2016-05-04 08:56:42    3
2016-05-04 08:56:43    0
2016-05-04 08:58:20    1
2016-05-04 08:58:21    1
2016-05-04 08:58:22    3
2016-05-04 08:58:23    9
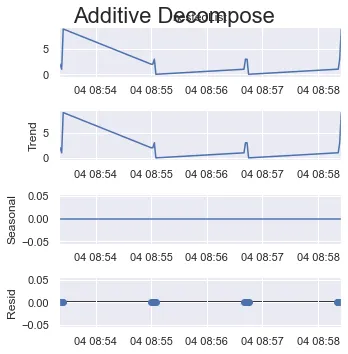
现在看一下不同期间的整数值。
period = 1:
result_add = seasonal_decompose(x=df_test['listData'], model='additive', extrapolate_trend='freq', period=1)
plt.rcParams.update({'figure.figsize': (5,5)})
result_add.plot().suptitle('Additive Decompose', fontsize=22)
plt.show()
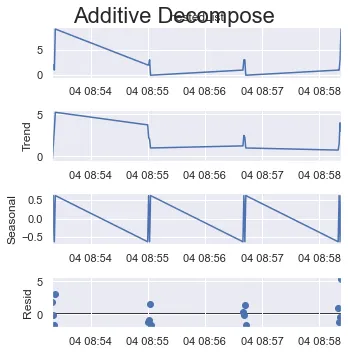
周期 = 2:
result_add = seasonal_decompose(x=df_test['listData'], model='additive', extrapolate_trend='freq', period=2)
plt.rcParams.update({'figure.figsize': (5,5)})
result_add.plot().suptitle('Additive Decompose', fontsize=22)
plt.show()
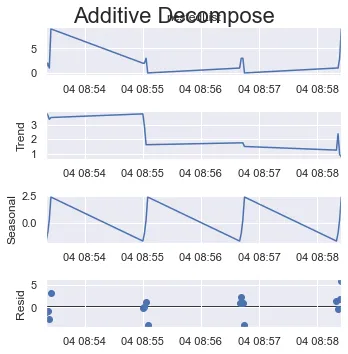
如果将所有项目的四分之一视为一个周期,这里有4个(16个项目中的4个)。
period = 4:
result_add = seasonal_decompose(x=df_test['listData'], model='additive', extrapolate_trend='freq', period=int(len(df_test)/4))
plt.rcParams.update({'figure.figsize': (5,5)})
result_add.plot().suptitle('Additive Decompose', fontsize=22)
plt.show()
或者,如果您将一个循环的最大可能大小设置为8(在16个项目中)。
周期 = 8:
result_add = seasonal_decompose(x=df_test['listData'], model='additive', extrapolate_trend='freq', period=int(len(df_test)/2))
plt.rcParams.update({'figure.figsize': (5,5)})
result_add.plot().suptitle('Additive Decompose', fontsize=22)
plt.show()
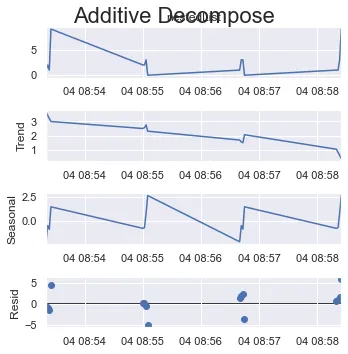
看一下y轴如何改变它们的刻度。
####
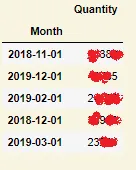
根据您的需求,您将增加周期整数。在您所提出的问题中,最大值为{{max}}。
sm.tsa.seasonal_decompose(df, model = 'additive', period = int(len(df)/2))
2.的详细信息:"...或x必须是带有未设置为None的频率的DatetimeIndex的pandas对象"
要将x设置为具有未设置为None的频率的DatetimeIndex,您需要使用.asfreq('?')来分配DatetimeIndex的频率,其中?是您在https://pandas.pydata.org/pandas-docs/stable/user_guide/timeseries.html#offset-aliases中可选的范围内的偏移别名。
在您的情况下,此选项2.更适合您,因为您似乎有一个没有间隙的列表。然后,您的月度数据可能应该被引入为“月度开始频率”--> “MS”作为偏移别名:
sm.tsa.seasonal_decompose(df.asfreq('MS'), model = 'additive')
请参阅如何使用pd.to_datetime()设置频率?以获取更多详细信息,还包括如何处理间隙。
如果您的数据在时间上高度分散,因此有太多间隙需要填充,或者时间间隙对您来说并不重要,则使用“period”选项可能是更好的选择。
在我的示例df_test中,选项2.不好。数据在时间上完全分散,如果我将秒作为频率,您会得到以下结果:
df_test.asfreq('s') 的输出(=以秒为频率):
2016-05-04 08:53:20      1
2016-05-04 08:53:21      2
2016-05-04 08:53:22      1
2016-05-04 08:53:23      9
2016-05-04 08:53:24    NaN
                      ...
2016-05-04 08:58:19    NaN
2016-05-04 08:58:20      1
2016-05-04 08:58:21      1
2016-05-04 08:58:22      3
2016-05-04 08:58:23      9
Freq: S, Name: listData, Length: 304, dtype: object
你可以看到,尽管我的数据只有16行,但是引入秒频率会导致df只有304行,从"08:53:20"到"08:58:23",这里产生了288个间隙。此外,你必须准确命中时间。如果你的实际频率是0.1甚至0.12314秒,你将无法用索引命中大多数项目。
这里以min为偏移别名的示例:
df_test.asfreq('min')
2016-05-04 08:53:20      1
2016-05-04 08:54:20    NaN
2016-05-04 08:55:20    NaN
2016-05-04 08:56:20    NaN
2016-05-04 08:57:20    NaN
2016-05-04 08:58:20      1
我们可以看到只有第一和最后一分钟被填充了,其余时间没有命中。
将日期作为偏移别名,
df_test.asfreq('d'):
2016-05-04 08:53:20 1
我们可以看到,由于只覆盖了一天,所以只得到了第一行作为结果df,它将给出找到的第一项,其余部分将被删除。
一切的结束
综合所有这些,在您的情况下,请选择选项2,而在我的示例df_test案例中,则需要选项1。


period参数可能已被删除,但实际上并没有。在最新版本的statsmodels v0.13.2中,它在参数列表中,网址为https://www.statsmodels.org/stable/generated/statsmodels.tsa.seasonal.seasonal_decompose.html。然而,如何使用它仍是一个未解之谜,请参见[statsmodels seasonal_decompose(): What is the right "period of the series" in the context of a list column (constant vs. varying number of items)](https://stats.stackexchange.com/questions/482089/statsmodels-seasonal-decompose-what-is-the-right-period-of-the-series-in-th)。 - questionto42