我使用 diagrammer::mermaid 在 R 中制作了这个甘特图(下面是可重复的代码):
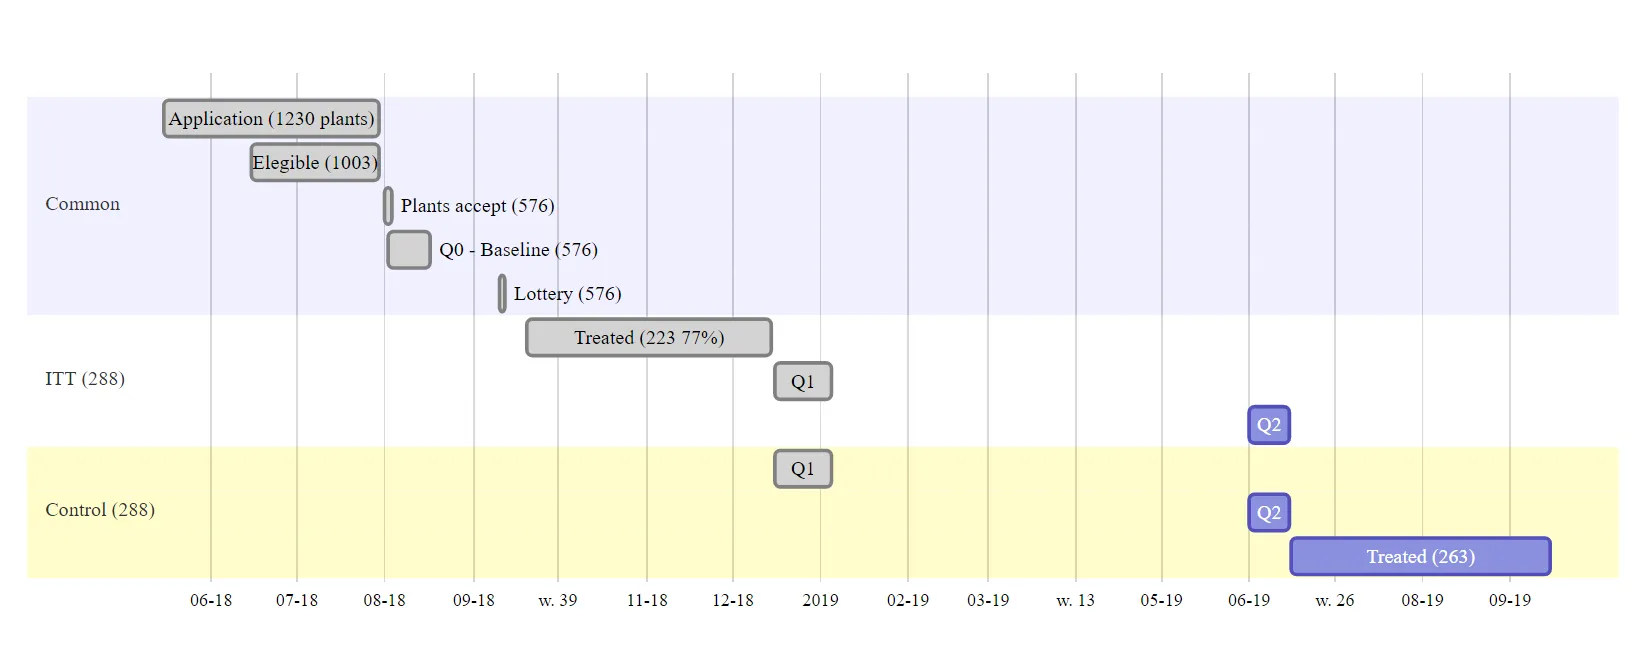
虽然很漂亮, 但我想要:
- 增加字体大小(我认为这会使每一行变宽,使得当前非常长的矩形略微更加“正方形”。我可以接受这个)
- 使时间轴标签更加标准化。对于有些人来说,周数,对于其他人来说,月份似乎非常奇怪。我希望能够简洁地区分月份和年份)
我如何实现这些改变?
我是一个只会 R 的用户,对 node.js、css 等一无所知。我设法在网上找到了创建这个的代码片段,但不理解 style_widget 或如何更改它。
devtools::install_github('rich-iannone/DiagrammeR')
library(DiagrammeR)
library(tidyverse) #just for the pipe operator

style_widget <- function(hw=NULL, style="", addl_selector="") {
  stopifnot(!is.null(hw), inherits(hw, "htmlwidget"))

  # use current id of htmlwidget if already specified
  elementId <- hw$elementId
  if(is.null(elementId)) {
    # borrow htmlwidgets unique id creator
    elementId <- sprintf(
      'htmlwidget-%s',
      htmlwidgets:::createWidgetId()
    )
    hw$elementId <- elementId
  }

  htmlwidgets::prependContent(
    hw,
    htmltools::tags$style(
      sprintf(
        "#%s %s {%s}",
        elementId,
        addl_selector,
        style
      )
    )
  )
}


flx_BmP  <- mermaid("
                    gantt
                    dateFormat  YYYY-MM-DD

                    section Common
                    Application (1230 plants) :done, first_1,  2018-05-15, 2018-07-30
                    Elegible (1003)           :done, first_1,  2018-06-15, 45d
                    Plants accept (576)       :done, first_1,  2018-08-01, 2d
                    Q0 - Baseline (576)       :done, first_1,  2018-08-02, 15d
                    Lottery (576)            :done, first_1,  2018-09-10, 2d

                    section ITT (288)
                    Treated (223 77%)        :done, first_2,  2018-09-20, 2018-12-15
                    Q1                       :done, first_3,  2018-12-16, 2019-01-05
                    Q2                       :      first_3,  2019-06-01, 2019-06-15

                    section Control (288)
                    Q1                       :done, first_3,  2018-12-16, 2019-01-05
                    Q2                       :      first_3,  2019-06-01, 2019-06-15
                    Treated (263)            :      first_3,  2019-06-16, 2019-09-15
                    ") %>%
  style_widget("display:none", "line.today")

flx_BmP
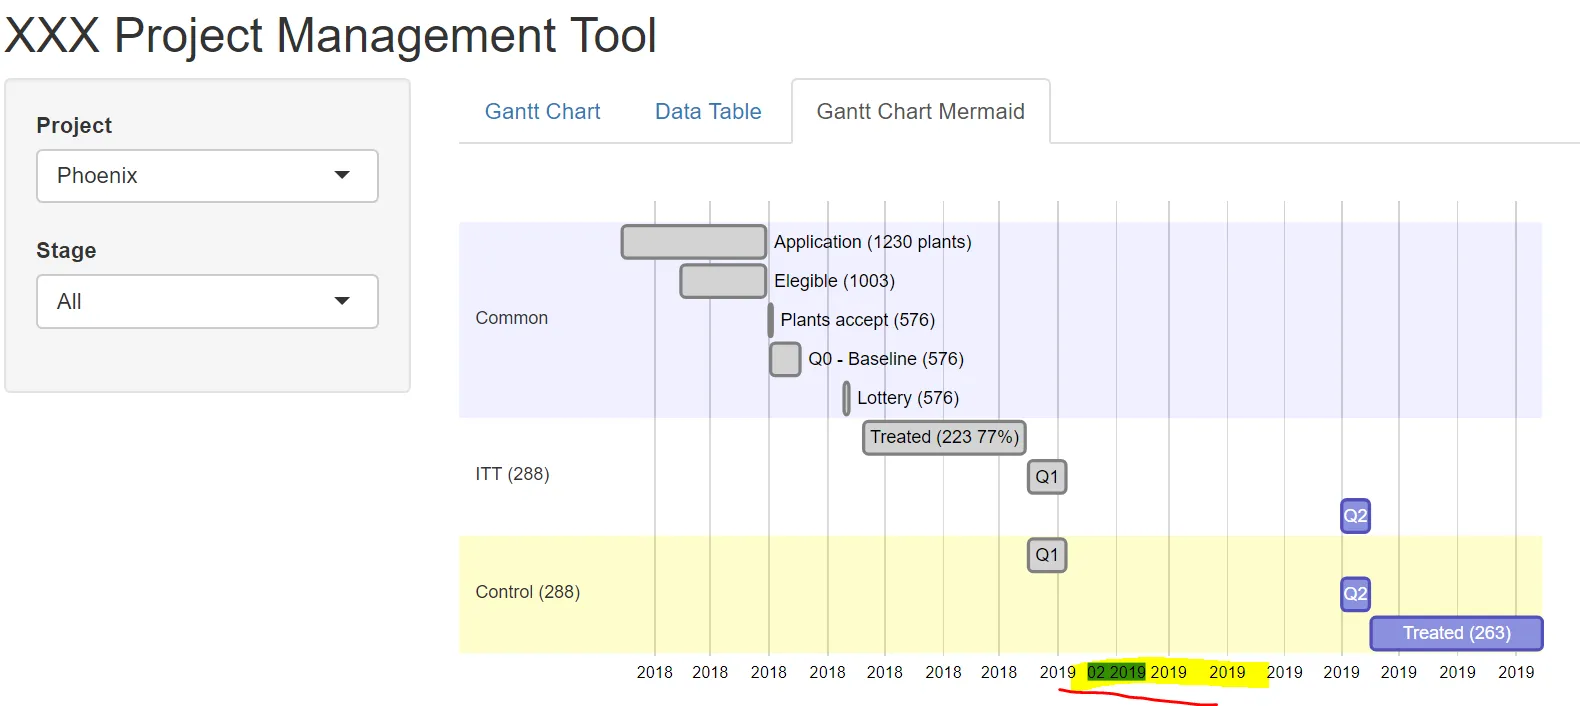
axisFormat %d/%m后,图表消失了(输出为全白屏幕)。上面的示例应该是完全可重现的,您能否尝试在您的端上运行它并添加格式?我发现这个答案指向了font-size:50px可能需要调整。当我添加这个(但不是 axisformat)时,图表仍然计算,但字体大小没有改变。 - LucasMation.today { fill: none; stroke: red; stroke-width: 0px;}。这个问题建议使用style_widget(m1, "display:none", "line.today")在R中转换图形对象。我如何在实时编辑器中更改它? - LucasMation