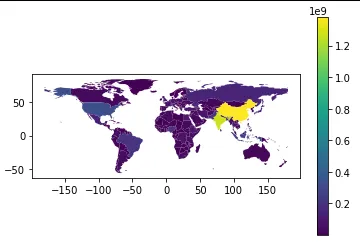
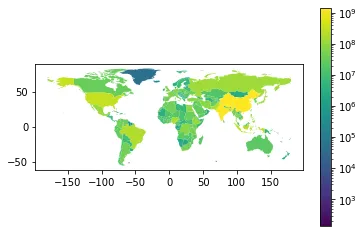
如果我有如下图所示的图表,我该如何将颜色图例/标注变成对数刻度?
import geopandas as gpd
import matplotlib.pyplot as plt

world = gpd.read_file(gpd.datasets.get_path('naturalearth_lowres'))
world = world[(world.pop_est>0) & (world.name!="Antarctica")]
fig, ax = plt.subplots(1, 1)
world.plot(column='pop_est', ax=ax, legend=True)
AttributeError: module 'matplotlib.pyplot' has no attribute 'colors'的问题。在我的脚本开头,我有import matplotlib.colors as colors。 - Stückematplotlib:) - Stückeexplore方法有什么内容吗? - Vovin