我正在使用 R 编程语言。
我之前已经制作了以下 8 张图,并将它们保存为 HTML 文件放在我的工作目录中:
library(plotly)
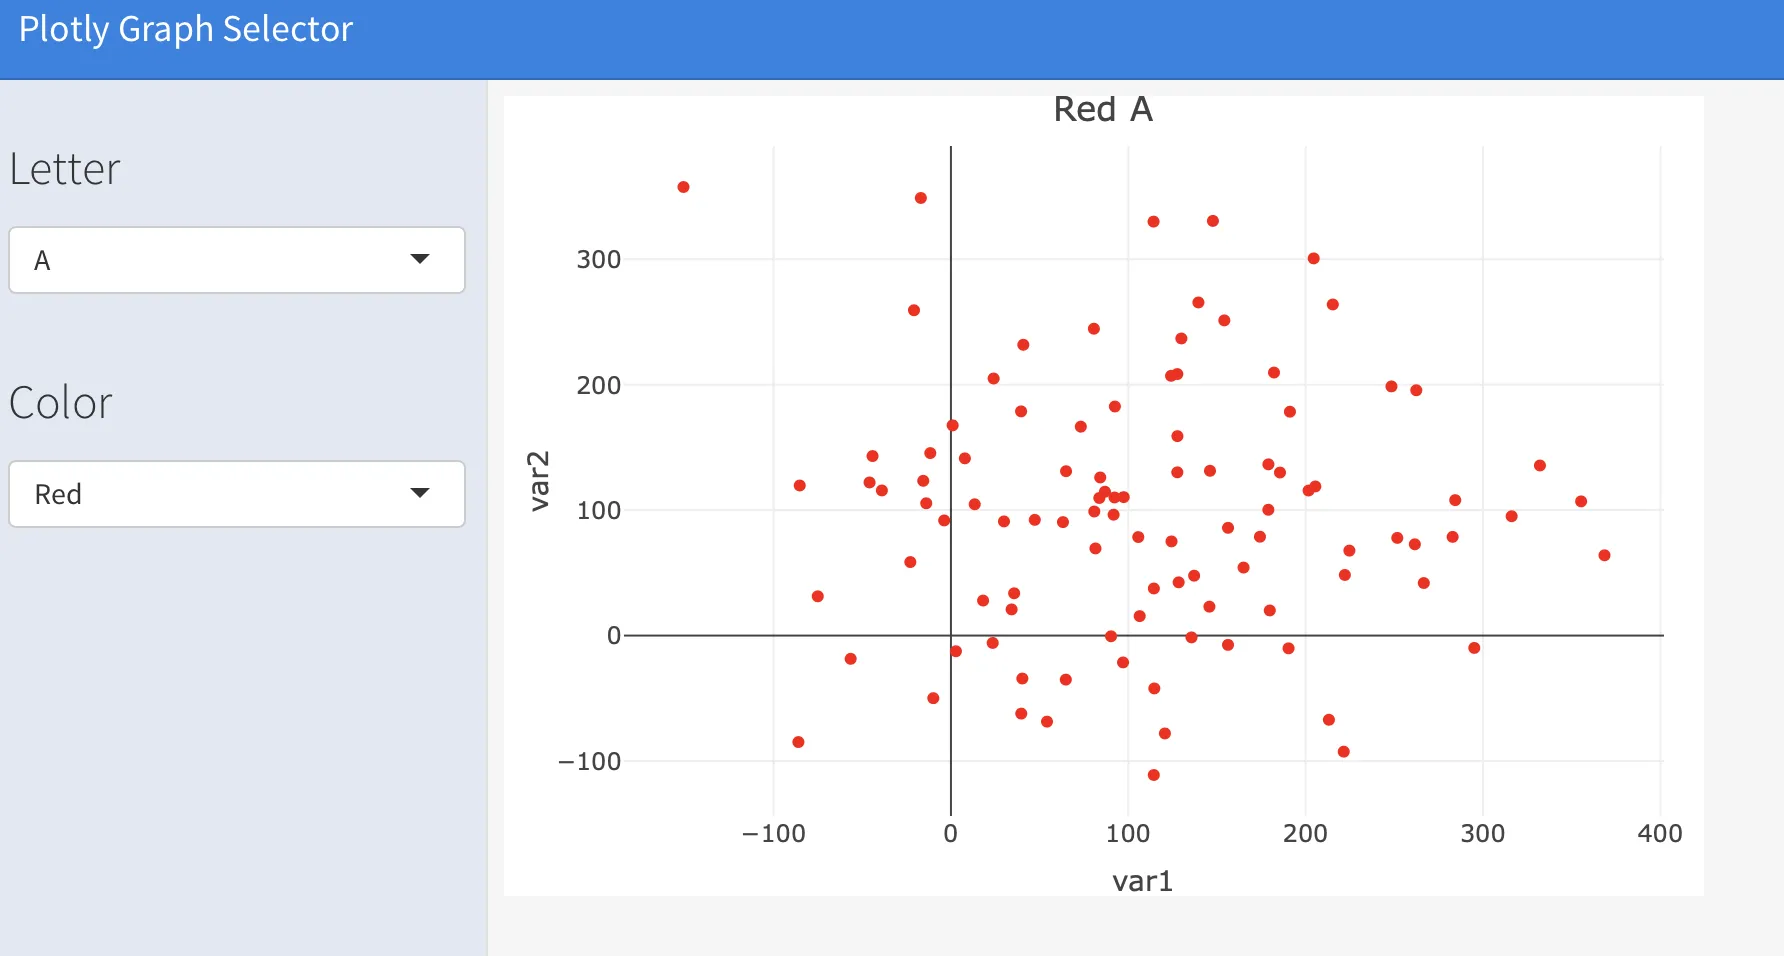
Red_A <- data.frame(var1 = rnorm(100,100,100), var2 = rnorm(100,100,100)) %>%
plot_ly(x = ~var1, y = ~var2, marker = list(color = "red")) %>%
layout(title = 'Red A')
Red_B <- data.frame(var1 = rnorm(100,100,100), var2 = rnorm(100,100,100)) %>%
plot_ly(x = ~var1, y = ~var2, marker = list(color = "red")) %>%
layout(title = 'Red B')
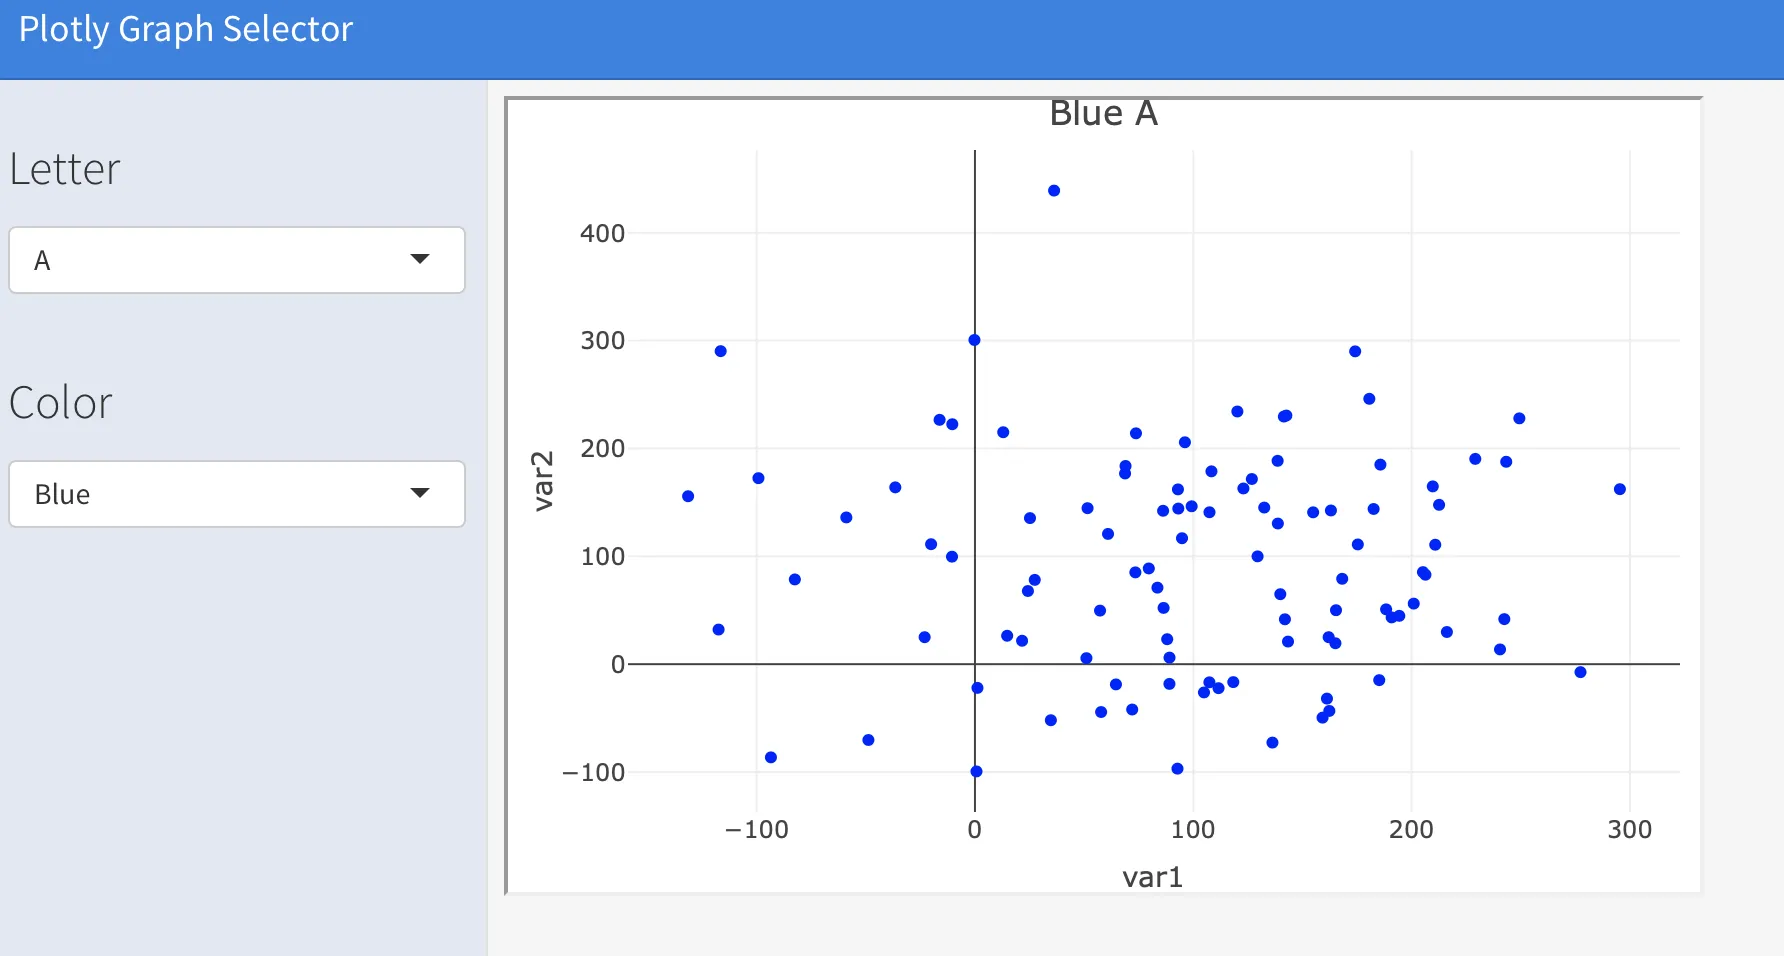
Blue_A <- data.frame(var1 = rnorm(100,100,100), var2 = rnorm(100,100,100)) %>%
plot_ly(x = ~var1, y = ~var2, marker = list(color = "blue")) %>%
layout(title = 'Blue A')
Blue_B <- data.frame(var1 = rnorm(100,100,100), var2 = rnorm(100,100,100)) %>%
plot_ly(x = ~var1, y = ~var2, marker = list(color = "red")) %>%
layout(title = 'Blue B')
htmlwidgets::saveWidget(as_widget(Red_A), "Red_A.html")
htmlwidgets::saveWidget(as_widget(Red_B), "Red_B.html")
htmlwidgets::saveWidget(as_widget(Blue_A), "Blue_A.html")
htmlwidgets::saveWidget(as_widget(Blue_B), "Blue_B.html")
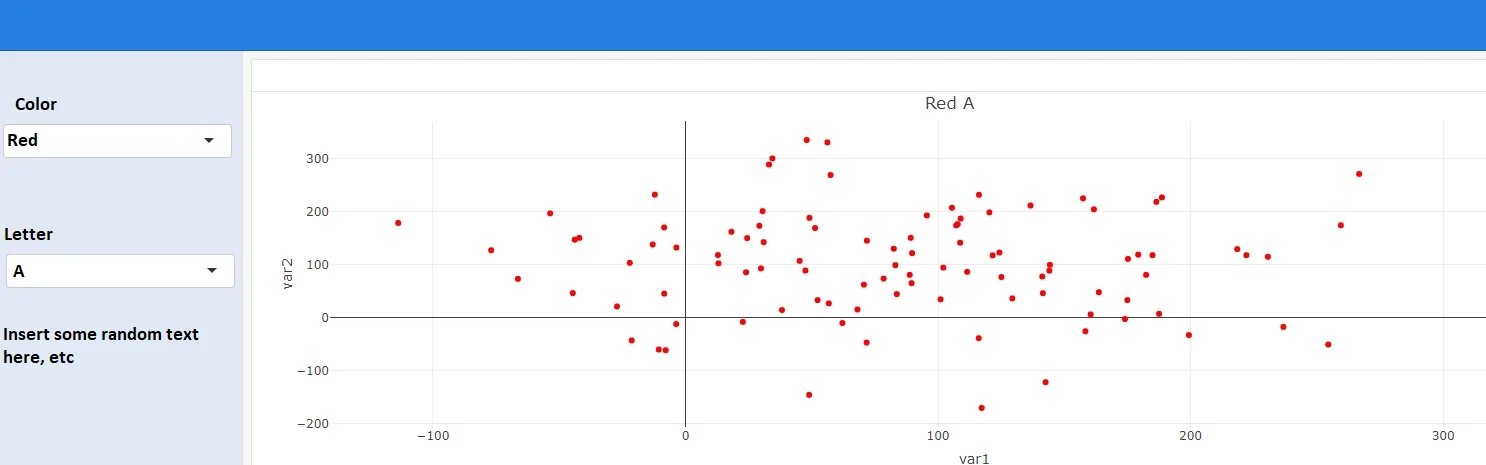
我的问题:使用这个模板(https://testing-apps.shinyapps.io/flexdashboard-shiny-biclust/),我想制作一个flexdashboard,允许用户从两个下拉菜单中选择“颜色”和“字母”,然后呈现相应的图形之一(例如col = Red&letter = B ->“Red B”)。然后,我希望能够将最终产品本身保存为HTML文件。这将看起来像这样:
我尝试通过调整教程来编写适用于此问题的Rmarkdown代码:
---
title: "Plotly Graph Selector"
output:
  flexdashboard::flex_dashboard:
  orientation: columns
vertical_layout: fill
runtime: shiny
---


Inputs {.sidebar}
 selectInput("Letter", label = h3("Letter"),
    choices = list("A" = 1, "B" = 2),
    selected = 1)

 selectInput("Color", label = h3("Color"),
    choices = list("Red" = 1, "Blue" = 2),
    selected = 1)
我该如何继续进行?
注意
我知道可以将预先制作的HTML文件加载到仪表板中,例如:
# https://dev59.com/MMT5oIgBc1ULPQZFw3s6
<object class="one" type="text/html" data="Red_A.html"></object>
<object class="one" type="text/html" data="Red_B.html"></object>
<object class="one" type="text/html" data="Blue_A.html"></object>
<object class="one" type="text/html" data="Blue_B.html"></object>
getwd替换addResourcepath中的 "~/Downloads" 吗? - QuintenaddResourcePath的第一个参数了。请再次检查编辑。 - Quinten