是否可以更改线的位置,使其起点和终点位于堆积条形图的边缘而不是中心位置?
R 代码:
library(ggplot2)
plot11 = ggplot(CombinedThickness2[CombinedThickness2$DepSequence == "Original",], aes(x = Well, y = Thickness, fill = Sequence, alpha = Visible, width = 0.3)) +
  geom_bar(stat = "identity") +
  scale_y_reverse()
plot11 = plot11 + geom_line(aes(group = Sequence, y = Depth, color = Sequence))
plot11
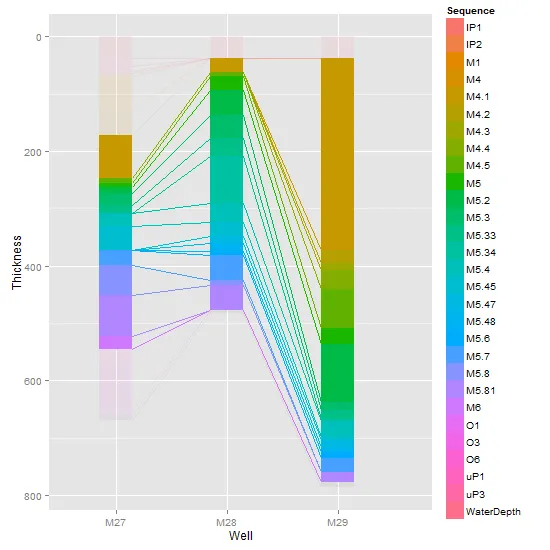
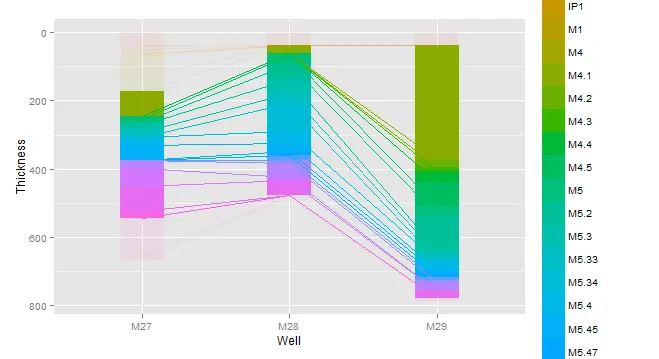
当前图片:
数据: