我想创建一个具有不同颜色垂直线的ggplot图表。以下是实现此目标的一种方法。
mtcars$colors = rep(1:4, nrow(mtcars)/4)
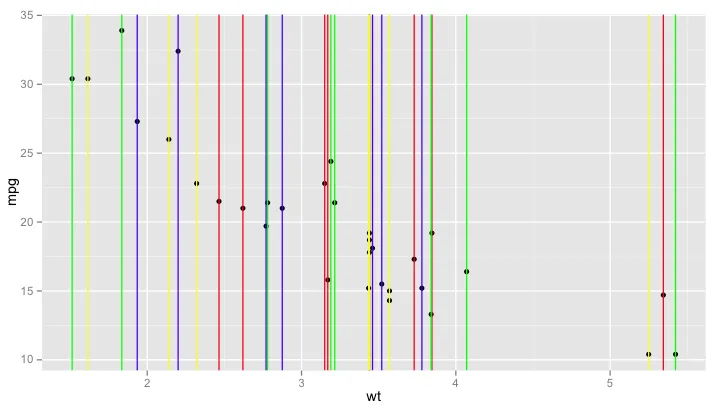
ggplot(mtcars, aes(x=wt, y=mpg)) +
geom_point() +
geom_vline(xintercept=subset(mtcars, colors==1)$wt, color="red") +
geom_vline(xintercept=subset(mtcars, colors==2)$wt, color="blue") +
geom_vline(xintercept=subset(mtcars, colors==3)$wt, color="yellow") +
geom_vline(xintercept=subset(mtcars, colors==4)$wt, color="green")
当变量colors的取值有50种不同的时候,这个解决方案并不是很方便。首先,它要求用户编写非常长的表达式(或迭代构建ggplot对象)。其次,它也不会为颜色生成图例。那么有更好的解决方案吗?