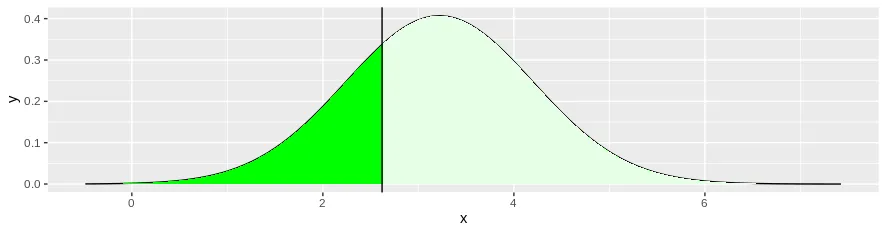
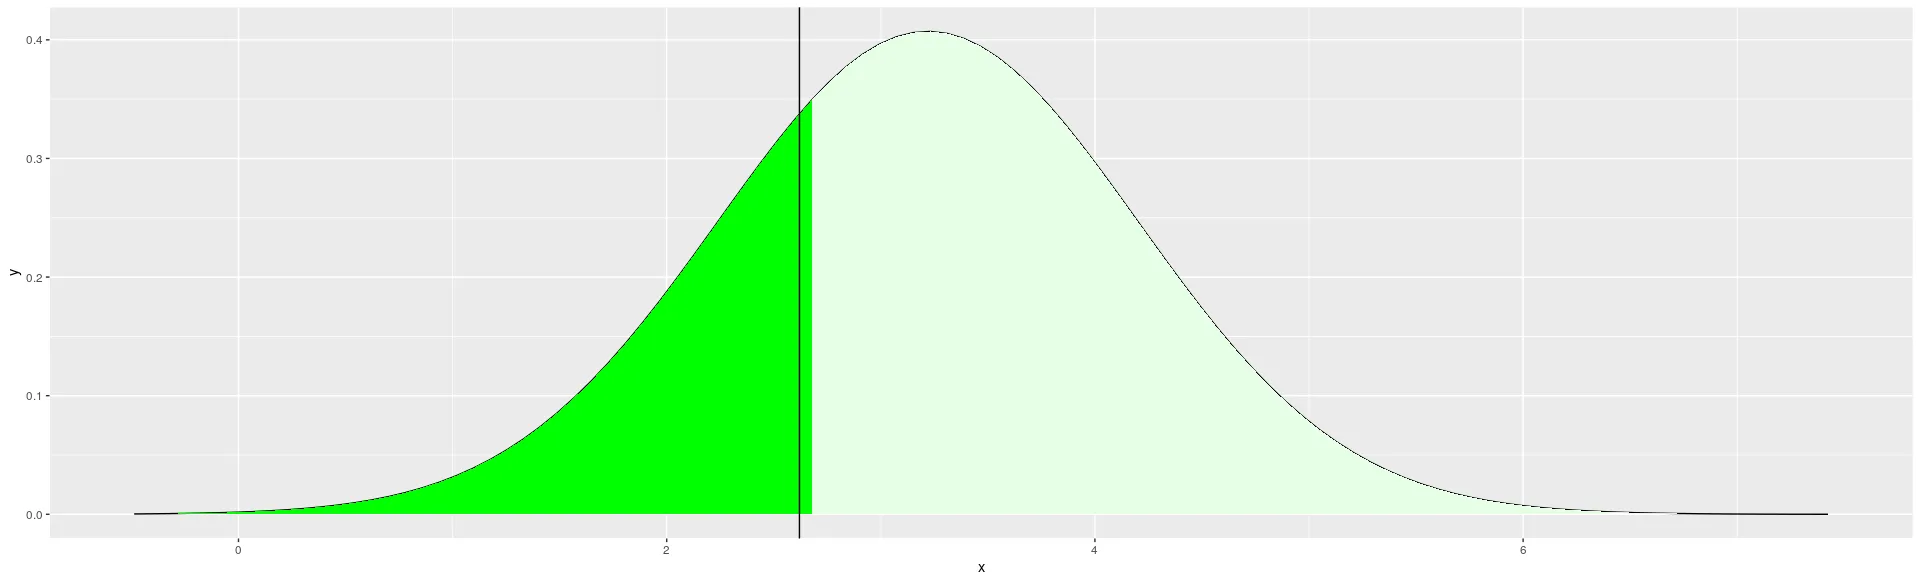
我正在尝试调整同时使用
stat_function和geom_vline的绘图层。我的问题是垂直线与绿色区域不完全对齐:
all_mean <- mean(mtcars$wt,na.rm = T)%>% round(2)
all_sd <- sd(mtcars$wt,na.rm = T)%>% round(2)
my_score <- mtcars[1,"wt"]


dd <- function(x) { dnorm(x, mean=all_mean, sd=all_sd) }

z <- (my_score - all_mean)/all_sd

pc <- round(100*(pnorm(z)), digits=0)

t1 <- paste0(as.character(pc),"th percentile")

p33 <- all_mean + (qnorm(0.3333) * all_sd)
p67 <- all_mean + (qnorm(0.6667) * all_sd)

funcShaded <- function(x, lower_bound) {
  y = dnorm(x, mean = all_mean, sd = all_sd)
  y[x < lower_bound] <- NA
  return(y)
}

greenShaded <- function(x, lower_bound) {
  y = dnorm(x, mean = all_mean, sd = all_sd)
  y[x > (all_mean*2)] <- NA
  return(y)
}

ggplot(data.frame(x=c(min(mtcars$wt-2), max(mtcars$wt+2))), aes(x=x)) +
  stat_function(fun=dd, colour="black") +
  stat_function(fun = greenShaded, args = list(lower_bound = pc),
                geom = "area", fill = "green", alpha = 1)+
    stat_function(fun = funcShaded, args = list(lower_bound = my_score),
                geom = "area", fill = "white", alpha = .9)+
  geom_vline(aes(xintercept=my_score), colour="black")