我一直在学习k-means聚类,但有一件事不太清楚,那就是如何选择k的值。这仅仅是试错还是还有其他因素呢?
20个回答
2
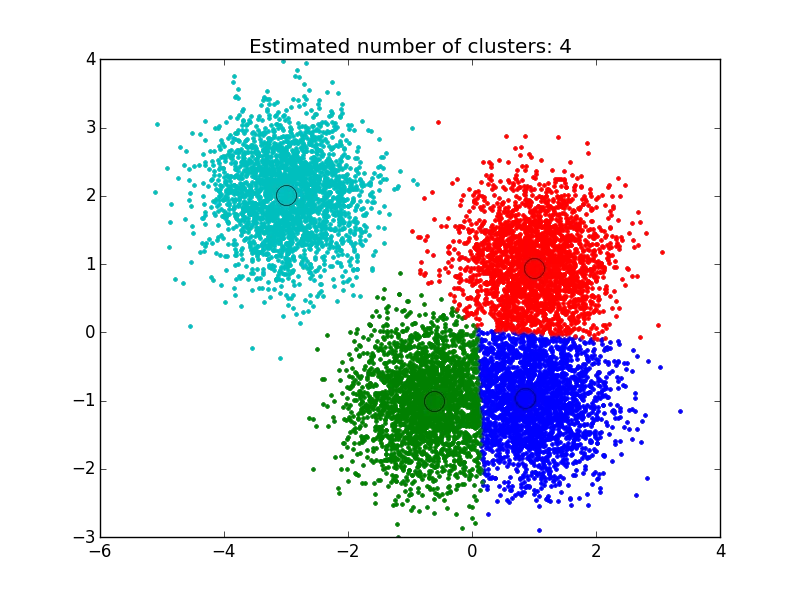
我使用了在这里找到的解决方案:http://efavdb.com/mean-shift/,它对我非常有效:
import numpy as np
from sklearn.cluster import MeanShift, estimate_bandwidth
from sklearn.datasets.samples_generator import make_blobs
import matplotlib.pyplot as plt
from itertools import cycle
from PIL import Image

#%% Generate sample data
centers = [[1, 1], [-.75, -1], [1, -1], [-3, 2]]
X, _ = make_blobs(n_samples=10000, centers=centers, cluster_std=0.6)

#%% Compute clustering with MeanShift

# The bandwidth can be automatically estimated
bandwidth = estimate_bandwidth(X, quantile=.1,
                               n_samples=500)
ms = MeanShift(bandwidth=bandwidth, bin_seeding=True)
ms.fit(X)
labels = ms.labels_
cluster_centers = ms.cluster_centers_

n_clusters_ = labels.max()+1

#%% Plot result
plt.figure(1)
plt.clf()

colors = cycle('bgrcmykbgrcmykbgrcmykbgrcmyk')
for k, col in zip(range(n_clusters_), colors):
    my_members = labels == k
    cluster_center = cluster_centers[k]
    plt.plot(X[my_members, 0], X[my_members, 1], col + '.')
    plt.plot(cluster_center[0], cluster_center[1],
             'o', markerfacecolor=col,
             markeredgecolor='k', markersize=14)
plt.title('Estimated number of clusters: %d' % n_clusters_)
plt.show()
- snoob dogg
1
假设您有一个名为
DATA的数据矩阵,您可以像这样执行基于中心点的分区,并估计聚类数(通过轮廓分析):library(fpc)
maxk <- 20 # arbitrary here, you can set this to whatever you like
estimatedK <- pamk(dist(DATA), krange=1:maxk)$nc
- Megatron
1
km=[]
for i in range(num_data.shape[1]):
    kmeans = KMeans(n_clusters=ncluster[i])#we take number of cluster bandwidth theory
    ndata=num_data[[i]].dropna()
    ndata['labels']=kmeans.fit_predict(ndata.values)
    cluster=ndata
    co=cluster.groupby(['labels'])[cluster.columns[0]].count()#count for frequency
    me=cluster.groupby(['labels'])[cluster.columns[0]].median()#median
    ma=cluster.groupby(['labels'])[cluster.columns[0]].max()#Maximum
    mi=cluster.groupby(['labels'])[cluster.columns[0]].min()#Minimum
    stat=pd.concat([mi,ma,me,co],axis=1)#Add all column
    stat['variable']=stat.columns[1]#Column name change
    stat.columns=['Minimum','Maximum','Median','count','variable']
    l=[]
    for j in range(ncluster[i]):
        n=[mi.loc[j],ma.loc[j]]
        l.append(n)

    stat['Class']=l
    stat=stat.sort(['Minimum'])
    stat=stat[['variable','Class','Minimum','Maximum','Median','count']]
    if missing_num.iloc[i]>0:
        stat.loc[ncluster[i]]=0
        if stat.iloc[ncluster[i],5]==0:
            stat.iloc[ncluster[i],5]=missing_num.iloc[i]
            stat.iloc[ncluster[i],0]=stat.iloc[0,0]
    stat['Percentage']=(stat[[5]])*100/count_row#Freq PERCENTAGE
    stat['Cumulative Percentage']=stat['Percentage'].cumsum()
    km.append(stat)
cluster=pd.concat(km,axis=0)## see documentation for more info
cluster=cluster.round({'Minimum': 2, 'Maximum': 2,'Median':2,'Percentage':2,'Cumulative Percentage':2})
- sumit
2
你选择数据和库添加,然后复制 km=[] 到 Percentage':2}) 最后运行你的 Python 代码并查看结果。 - sumit
欢迎来到Stack Overflow!虽然这段代码可能有助于解决问题,但它并没有解释为什么以及如何回答这个问题。提供这种额外的上下文将显著提高其长期教育价值。请编辑您的答案以添加说明,包括适用的限制和假设。 - Toby Speight
1
另一种方法是使用自组织映射(SOP)来找到最佳聚类数。 SOM(自组织映射)是一种无监督的神经网络方法,仅需要输入用于问题解决的聚类。该方法在有关客户细分的论文中使用。
该论文的参考文献为:
Abdellah Amine等人,“基于聚类技术和LRFM模型的电子商务客户细分模型:摩洛哥在线商店的案例”,World Academy of Science,Engineering and Technology国际计算机与信息工程期刊,卷:9,号:8,2015,1999-2010。
该论文的参考文献为:
Abdellah Amine等人,“基于聚类技术和LRFM模型的电子商务客户细分模型:摩洛哥在线商店的案例”,World Academy of Science,Engineering and Technology国际计算机与信息工程期刊,卷:9,号:8,2015,1999-2010。
- boyaronur
1
一种可能的解决方案是使用元启发式算法,如遗传算法来找到k值。 这很简单。您可以使用随机K(在某个范围内),并使用一些测量方法,如Silhouette评估遗传算法的适合度函数。 然后根据适合度函数找到最佳的K值。
- Masoud
0
嗨,我会简单明了地解释一下,我想使用'NbClust'库来确定聚类。
现在,如何使用'NbClust'函数确定正确的聚类数量:您可以在Github上检查实际项目,其中包含实际数据和聚类 - 还使用正确数量的“中心”执行了此'kmeans'算法的扩展。
Github项目链接:https://github.com/RutvijBhutaiya/Thailand-Customer-Engagement-Facebook
- Rutvij
1
你能否添加几行关键代码,以帮助他人,即使你的代码无法访问,而不是添加github链接? - Giulio Caccin
0
在此留下一张来自 Codecademy 课程的很酷的 gif:
K-Means 算法:
- 为初始聚类设置 k 个随机质心。
- 将数据样本分配到最近的质心。
- 根据上述分配的数据样本更新质心。
顺便说一下,这并不是完整算法的解释,只是有帮助的可视化。
- Pobaranchuk
0
我曾经参与开发一个名为kneed(Kneedle算法)的Python包。它可以动态地找到聚类数,即曲线开始变平的点。给定一组x和y值,kneed将返回函数的拐点。拐点是最大曲率点。以下是示例代码。
y = [7342.1301373073857, 6881.7109460930769, 6531.1657905495022,
6356.2255554679778, 6209.8382535595829, 6094.9052166741121,
5980.0191582610196, 5880.1869867848218, 5779.8957906367368,
5691.1879324562778, 5617.5153566271356, 5532.2613232619951,
5467.352265375117, 5395.4493783888756, 5345.3459908298091,
5290.6769823693812, 5243.5271656371888, 5207.2501206569532,
5164.9617535255456]

x = range(1, len(y)+1)

from kneed import KneeLocator
kn = KneeLocator(x, y, curve='convex', direction='decreasing')

print(kn.knee)
- madhuri M
1
请在您的答案中添加一些解释,以便其他人可以从中学习。 - Nico Haase
0
你可以通过视觉检查数据点来选择聚类的数量,但很快你会意识到对于除了最简单的数据集外,这个过程存在很多模糊性。这并不总是坏事,因为你正在进行无监督学习,标记过程中有一些固有的主观性。在这种情况下,具有该特定问题或类似问题的以前经验将帮助你选择正确的值。
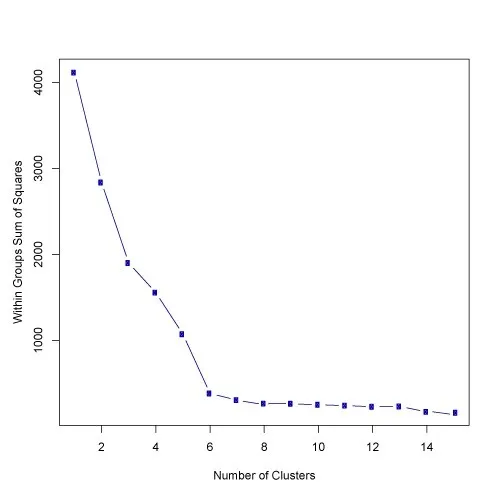
如果你想要一些关于应该使用的聚类数量的提示,你可以应用肘部方法:
首先,计算一些k值(例如2、4、6、8等)下的平方误差和(SSE)。SSE被定义为每个聚类成员与其质心之间的平方距离的总和。数学上表示为:
SSE=∑Ki=1∑x∈cidist(x,ci)2
如果你绘制k与SSE的图表,你会发现随着k的增大,误差会减小;这是因为当聚类数量增加时,它们应该更小,所以失真也更小。肘部方法的思想是选择SSE急剧减小的k值。这会在图表中产生一个“肘部效应”,如下图所示:
- Faisal Shahbaz
网页内容由stack overflow 提供, 点击上面的可以查看英文原文,
原文链接
原文链接
R)回答了一个类似的问题:stackoverflow.com/a/15376462/1036500 - Ben