基于时间戳的移动平均在PostgreSQL中

22

我想通过时间戳来执行移动平均。

我有两列数据:温度和时间戳(日期-时间),我想要基于每15分钟连续的温度观测结果进行移动平均。换句话说,选择数据来执行基于15分钟时间间隔的平均值计算。此外,不同时间序列可能具有不同数量的观测值。这意味着所有窗口大小都相等(15分钟),但每个窗口内的观测值数量可能不同。

例如:

对于第一个窗口,我们需要计算n个观测结果的平均值,对于第二个窗口,我们需要计算n+5个观测结果的平均值。

数据样本:

ID   时间戳                  温度
1    2007-09-14 22:56:12     5.39
2    2007-09-14 22:58:12     5.34
3    2007-09-14 23:00:12     5.16
4    2007-09-14 23:02:12     5.54
5    2007-09-14 23:04:12     5.30
6    2007-09-14 23:06:12     5.20
7    2007-09-14 23:10:12     5.39
8    2007-09-14 23:12:12     5.34
9    2007-09-14 23:20:12     5.16
10   2007-09-14 23:24:12     5.54
11   2007-09-14 23:30:12     5.30
12   2007-09-14 23:33:12     5.20
13   2007-09-14 23:40:12     5.39
14   2007-09-14 23:42:12     5.34
15   2007-09-14 23:44:12     5.16
16   2007-09-14 23:50:12     5.54
17   2007-09-14 23:52:12     5.30
18   2007-09-14 23:57:12 5.20

主要挑战:

如何在不同采样频率导致时间间隔不精确的情况下,学习编写代码以区分每15分钟。


滚动平均值是否会在新的15分钟窗口开始时“重新启动”?还是应该计算“最近”的15分钟平均值? - user330315
@a_horse_with_no_name,实际上,数据集包括4周的历史数据,我需要移动平均结果作为新的数据集。 - A.Amidi
那并没有回答我的问题。 - user330315
4个回答

12

你可以将表与其自身连接:

select l1.id, avg( l2.Temperature )
from l l1
inner join l l2 
   on l2.id <= l1.id and
      l2.Timestamps + interval '15 minutes' > l1.Timestamps
group by l1.id
order by id
;

结果:

| ID |            AVG |
-----------------------
|  1 |           5.39 |
|  2 |          5.365 |
|  3 | 5.296666666667 |
|  4 |         5.3575 |
|  5 |          5.346 |
|  6 | 5.321666666667 |
|  7 | 5.331428571429 |

注意:只有“努力工作”是做出来的。您应该将结果与原始表合并或附加新列到查询中。我不知道您最终需要的查询。采用此解决方案或寻求更多帮助。


9
假设您希望在每个15分钟的间隔之后重新启动滚动平均值:
select id, 
       temp,
       avg(temp) over (partition by group_nr order by time_read) as rolling_avg
from (       
  select id, 
         temp,
         time_read, 
         interval_group,
         id - row_number() over (partition by interval_group order by time_read) as group_nr
  from (
    select id, 
           time_read, 
           'epoch'::timestamp + '900 seconds'::interval * (extract(epoch from time_read)::int4 / 900) as interval_group,
           temp
    from readings
  ) t1
) t2
order by time_read;

这是基于 Depesz的解决方案 来按“时间范围”进行分组的。

以下是SQLFiddle示例:http://sqlfiddle.com/#!1/0f3f0/2


由于使用了 id - row_number() 作为 group_nr,我认为这只有在 ID 是连续的情况下才能起作用(即 ID 中不能有间隔)。 - TmTron
假设您想在每个15分钟间隔后重新启动滚动平均值——这不是滚动平均值的工作方式。 - Robert Mikes

4
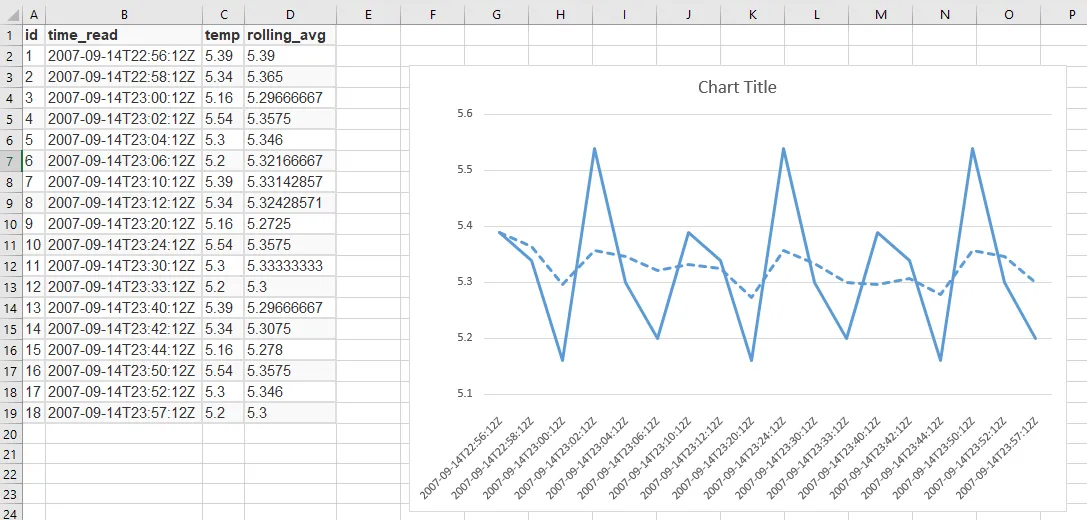
这里有一种方法利用聚合函数作为窗口函数来实现。聚合函数将过去15分钟的观测值保存在数组中,并保持当前运行总数。状态转换函数将落后于15分钟窗口的元素从数组中移除,并推入最新的观测值。最终函数仅计算数组中的平均温度。
至于这是否有益,这取决于情况。它侧重于postgresql的plgpsql执行部分而不是数据库访问部分,我的个人经验是plpgsql不够快。如果您可以轻松地查找表格以查找每个观测值之前的15分钟行,则自我连接(如@danihp答案中)将做得很好。但是,这种方法可以处理来自某些更复杂源的观察值,其中这些查找不切实际。请根据自己的系统进行试验和比较。
-- based on using this table definition
create table observation(id int primary key, timestamps timestamp not null unique,
                         temperature numeric(5,2) not null);

-- note that I'm reusing the table structure as a type for the state here
create type rollavg_state as (memory observation[], total numeric(5,2));

create function rollavg_func(state rollavg_state, next_in observation) returns rollavg_state immutable language plpgsql as $$
declare
  cutoff timestamp;
  i int;
  updated_memory observation[];
begin
  raise debug 'rollavg_func: state=%, next_in=%', state, next_in;
  cutoff := next_in.timestamps - '15 minutes'::interval;
  i := array_lower(state.memory, 1);
  raise debug 'cutoff is %', cutoff;
  while i <= array_upper(state.memory, 1) and state.memory[i].timestamps < cutoff loop
    raise debug 'shifting %', state.memory[i].timestamps;
    i := i + 1;
    state.total := state.total - state.memory[i].temperature;
  end loop;
  state.memory := array_append(state.memory[i:array_upper(state.memory, 1)], next_in);
  state.total := coalesce(state.total, 0) + next_in.temperature;
  return state;
end
$$;

create function rollavg_output(state rollavg_state) returns float8 immutable language plpgsql as $$
begin
  raise debug 'rollavg_output: state=% len=%', state, array_length(state.memory, 1);
  if array_length(state.memory, 1) > 0 then
    return state.total / array_length(state.memory, 1);
  else
    return null;
  end if;
end
$$;

create aggregate rollavg(observation) (sfunc = rollavg_func, finalfunc = rollavg_output, stype = rollavg_state);

-- referring to just a table name means a tuple value of the row as a whole, whose type is the table type
-- the aggregate relies on inputs arriving in ascending timestamp order
select rollavg(observation) over (order by timestamps) from observation;

0

根据dani herrera的回答

select l1.id,
       l1.time_read, 
       l1.temp ,
       avg( l2.Temp ) as rolling_avg
  from readings l1
 inner join readings l2 
    on l2.id <= l1.id and
       l2.time_read + interval '15 minutes' > l1.time_read
 group by l1.id
 order by time_read;

这里是一个 SQLFiddle: http://sqlfiddle.com/#!17/9db74/161,数据在图表中看起来像这样:

chart


网页内容由stack overflow 提供, 点击上面的
可以查看英文原文,
原文链接