在绘制的线上打印字符串(模仿等高线图标签)

14

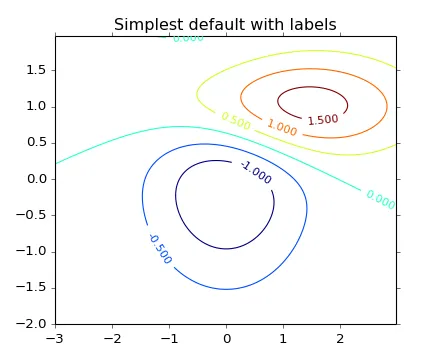
等高线图演示 显示了如何绘制曲线并在其上绘制级别值,如下所示:

enter image description here

是否有一种方法可以将下面代码生成的简单线性图形式转换为类似的效果?

import matplotlib.pyplot as plt 

x = [1.81,1.715,1.78,1.613,1.629,1.714,1.62,1.738,1.495,1.669,1.57,1.877,1.385]
y = [0.924,0.915,0.914,0.91,0.909,0.905,0.905,0.893,0.886,0.881,0.873,0.873,0.844]

# This is the string that should show somewhere over the plotted line.
line_string = 'name of line'

# plotting
plt.plot(x,y)
plt.show()

你是在寻找自动放置还是简单的注释? - Jakob
据我所知,等高线图中的级别是自动放置的,因此自动放置应该没问题。如果有一种方法可以决定字符串的位置,那就更好了。 - Gabriel
2个回答

17
你可以简单地添加一些文本(MPL Gallery),例如:
import matplotlib.pyplot as plt 
import numpy as np
x = [1.81,1.715,1.78,1.613,1.629,1.714,1.62,1.738,1.495,1.669,1.57,1.877,1.385]
y = [0.924,0.915,0.914,0.91,0.909,0.905,0.905,0.893,0.886,0.881,0.873,0.873,0.844]

# This is the string that should show somewhere over the plotted line.
line_string = 'name of line'

# plotting
fig, ax = plt.subplots(1,1)
l, = ax.plot(x,y)
pos = [(x[-2]+x[-1])/2., (y[-2]+y[-1])/2.]
# transform data points to screen space
xscreen = ax.transData.transform(zip(x[-2::],y[-2::]))
rot = np.rad2deg(np.arctan2(*np.abs(np.gradient(xscreen)[0][0][::-1])))
ltex = plt.text(pos[0], pos[1], line_string, size=9, rotation=rot, color = l.get_color(),
     ha="center", va="center",bbox = dict(ec='1',fc='1'))

def updaterot(event):
    """Event to update the rotation of the labels"""
    xs = ax.transData.transform(zip(x[-2::],y[-2::]))
    rot = np.rad2deg(np.arctan2(*np.abs(np.gradient(xs)[0][0][::-1])))
    ltex.set_rotation(rot)

fig.canvas.mpl_connect('button_release_event', updaterot)
plt.show()

这样做可以让您拥有最大的控制权。
请注意,旋转以度为单位,在屏幕空间中而不是数据空间中。

更新:

由于我最近需要自动标签旋转,需要在缩放和平移时更新,因此我更新了我的答案以满足这些需求。现在,标签旋转在每次鼠标按钮释放时更新(仅使用draw_event当缩放时不会触发)。 此方法使用matplotlib转换将数据空间和屏幕空间链接起来,如本教程所述。

这是一个很好的答案,非常感谢。如果我自己无法解决旋转角度问题(或者即使我解决了,为了完整起见),我会提出一个新的问题。干杯。 - Gabriel
我不得不将zip(x[-2::],y[-2::])替换为np.array((x[-2::],y[-2::]))才能使变换调用起作用。 - nedlrichards

6

基于Jakob的代码,这里提供了一个在数据空间中旋转文本、在给定x或y数据坐标附近放置标签,并且也适用于对数图的函数。

def label_line(line, label_text, near_i=None, near_x=None, near_y=None, rotation_offset=0, offset=(0,0)):
    """call 
        l, = plt.loglog(x, y)
        label_line(l, "text", near_x=0.32)
    """
    def put_label(i):
        """put label at given index"""
        i = min(i, len(x)-2)
        dx = sx[i+1] - sx[i]
        dy = sy[i+1] - sy[i]
        rotation = np.rad2deg(math.atan2(dy, dx)) + rotation_offset
        pos = [(x[i] + x[i+1])/2. + offset[0], (y[i] + y[i+1])/2 + offset[1]]
        plt.text(pos[0], pos[1], label_text, size=9, rotation=rotation, color = line.get_color(),
        ha="center", va="center", bbox = dict(ec='1',fc='1'))

    x = line.get_xdata()
    y = line.get_ydata()
    ax = line.get_axes()
    if ax.get_xscale() == 'log':
        sx = np.log10(x)    # screen space
    else:
        sx = x
    if ax.get_yscale() == 'log':
        sy = np.log10(y)
    else:
        sy = y

    # find index
    if near_i is not None:
        i = near_i
        if i < 0: # sanitize negative i
            i = len(x) + i
        put_label(i)
    elif near_x is not None:
        for i in range(len(x)-2):
            if (x[i] < near_x and x[i+1] >= near_x) or (x[i+1] < near_x and x[i] >= near_x):
                put_label(i)
    elif near_y is not None:
        for i in range(len(y)-2):
            if (y[i] < near_y and y[i+1] >= near_y) or (y[i+1] < near_y and y[i] >= near_y):
                put_label(i)
    else:
        raise ValueError("Need one of near_i, near_x, near_y")

1
我不确定你是否有意这样做,但是现在你的代码只有在x和y轴具有相同比例时,标签旋转角度才与曲线相同。如果你想让标签旋转到曲线上,你应该像Jakob的回答那样进行变换。 - NauticalMile
1
另外,对于任何其他使用此代码的人,请注意:确保您仅在绘制完成后使用此方法添加文本。如果您每次绘制曲线时都添加标签,则可能会调整x和/或y轴比例,并且最终图中标签的方向将不正确。 - NauticalMile

网页内容由stack overflow 提供, 点击上面的
可以查看英文原文,
原文链接