我想绘制一张图表,其中的一部分超出了绘图的限制。但是ggplot只是把这部分去掉而不是显示它的可见部分。
以下是一个示例以进行说明:
library(ggplot2)

df <- data.frame(x1 = 2, x2 = 6, y1 = 10, y2 = 50)

ggplot(mtcars, aes(wt, mpg)) +
    geom_point() +
    geom_segment(aes(x = x1, y = y1, xend = x2, yend = y2), data = df) +
    xlim(c(0, 7)) +
    ylim(c(0, 35)) +
    coord_fixed(.1)
这是我想要的:
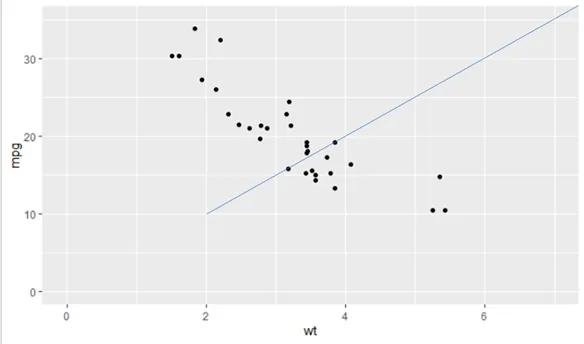 但实际上,这个部分没有被绘制出来,而且我得到了以下警告:
Warning message:
Removed 1 rows containing missing values (geom_segment).
我希望保持图表限制的固定和使用coord_fixed(.1)设置。
