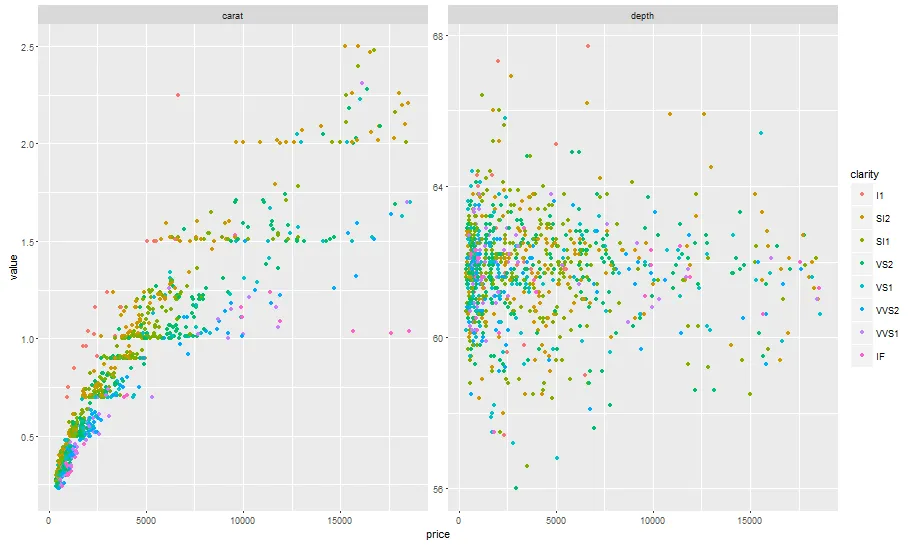
我希望能得到两个图表及其图例的组合图,格式如下:
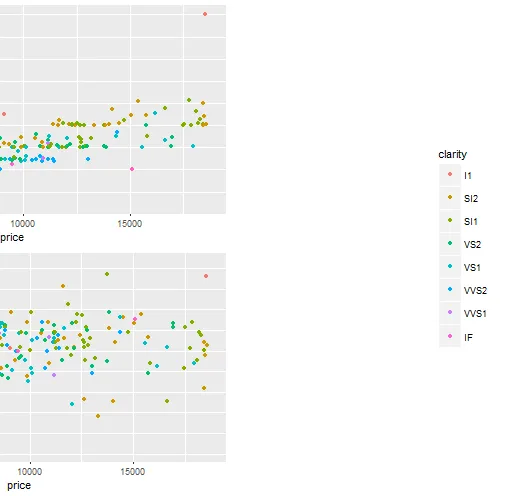
但这并不是将两个图表排列在一行,而是一个列中:
library(ggplot2)
library(grid)
library(gridExtra)
dsamp <- diamonds[sample(nrow(diamonds), 1000), ]
p1 <- qplot(price, carat, data=dsamp, colour=clarity)
p2 <- qplot(price, depth, data=dsamp, colour=clarity)
g <- ggplotGrob(p1 + theme(legend.position="bottom"))$grobs
legend <- g[[which(sapply(g, function(x) x$name) == "guide-box")]]
grid.arrange(arrangeGrob(p1+theme(legend.position="right"),p2+theme(legend.position="none"),legend,ncol=3,widths=c(3/7,3/7,1/7)))
然而我不想猜测图形和图例的宽度(并指定ncol),而是希望从p1和p2中提取它们如此展示。
因此,我期待需要像这样的代码(从链接中调整的代码):
grid_arrange_shared_legend_row <- function(...) {
  plots <- list(...)
  g <- ggplotGrob(plots[[1]] + theme(legend.position="right"))$grobs
  legend <- g[[which(sapply(g, function(x) x$name) == "guide-box")]]
  lwidth <- sum(legend$width)
  grid.arrange(
    do.call(arrangeGrob, lapply(plots, function(x)
      x + theme(legend.position="none"))),
    legend,
    ncol = length(plots)+1,
    widths = unit.c(rep(unit(1, "npc") - lwidth, length(plots)), lwidth))
}
grid_arrange_shared_legend_row(p1, p2)
但这并不是将两个图表排列在一行,而是一个列中: