将GPS纬度和经度跟踪数据转换为足球场上的位置x和位置y?

4
我目前有一个数据框,包含球员姓名、时间、纬度、经度和速度(以米/秒为单位)。我想绘制出球员的热力图,但问题在于将纬度和经度转换为足球场图片上的x和y位置。
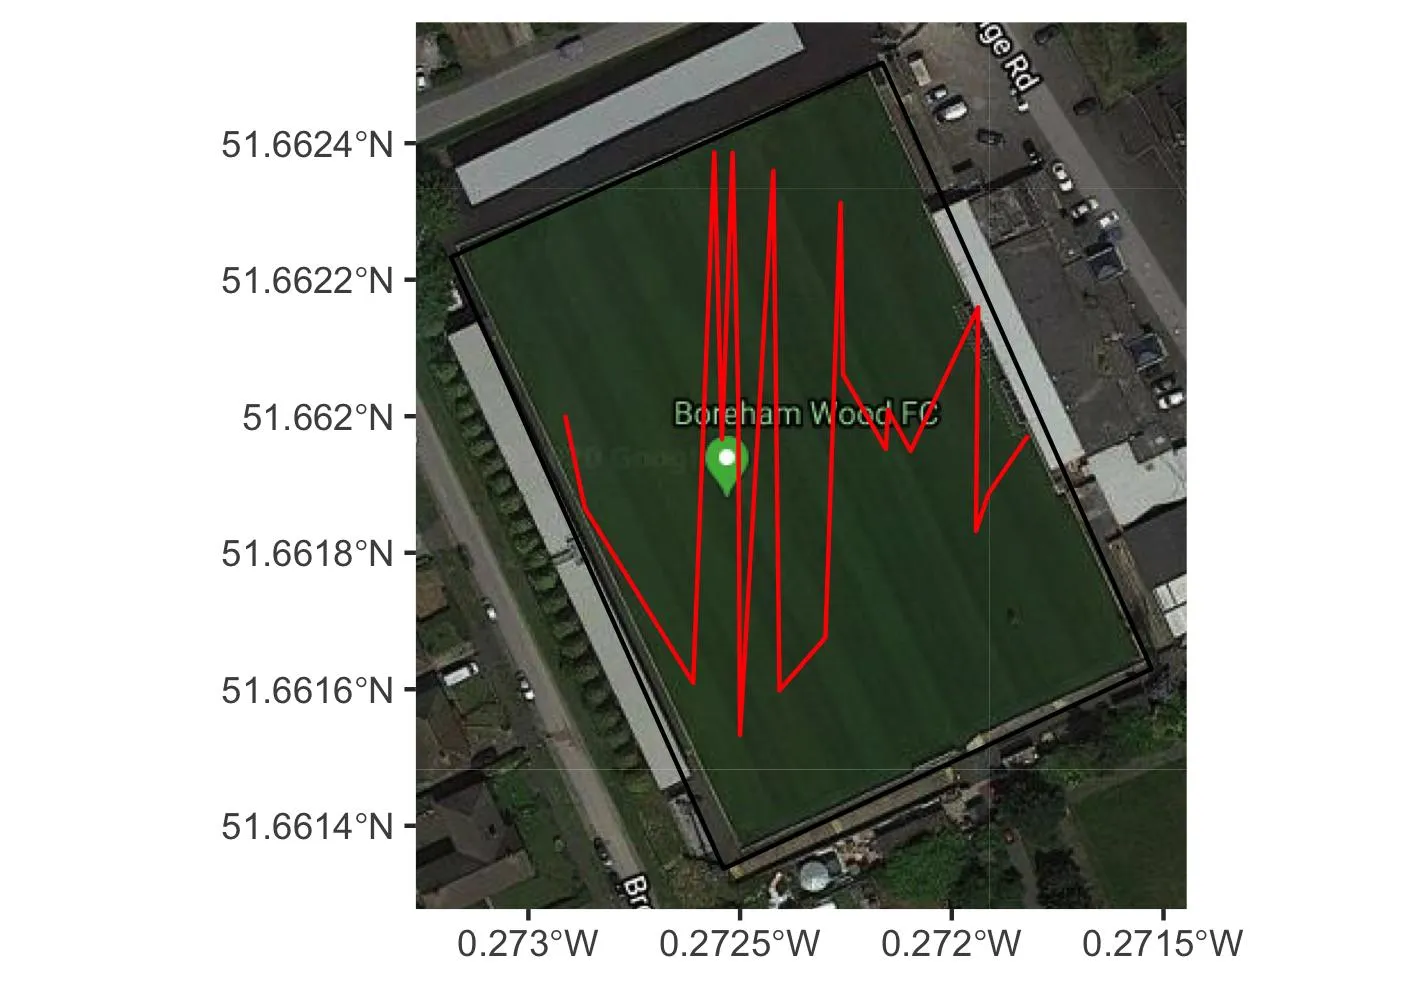
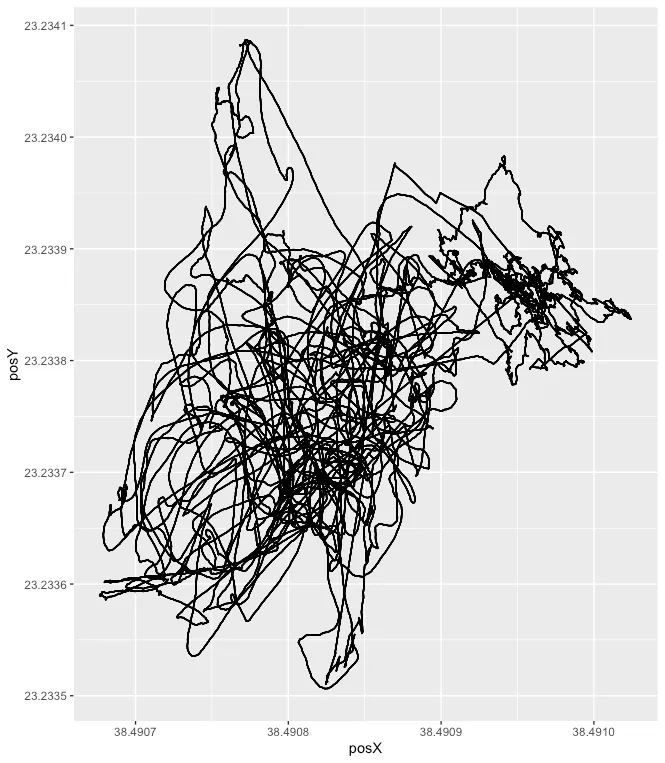
目前可以像下面的图1一样绘制出纬度和经度路径,但值的方向不是平坦足球场的方向,而是类似于图2。

enter image description here

enter image description here

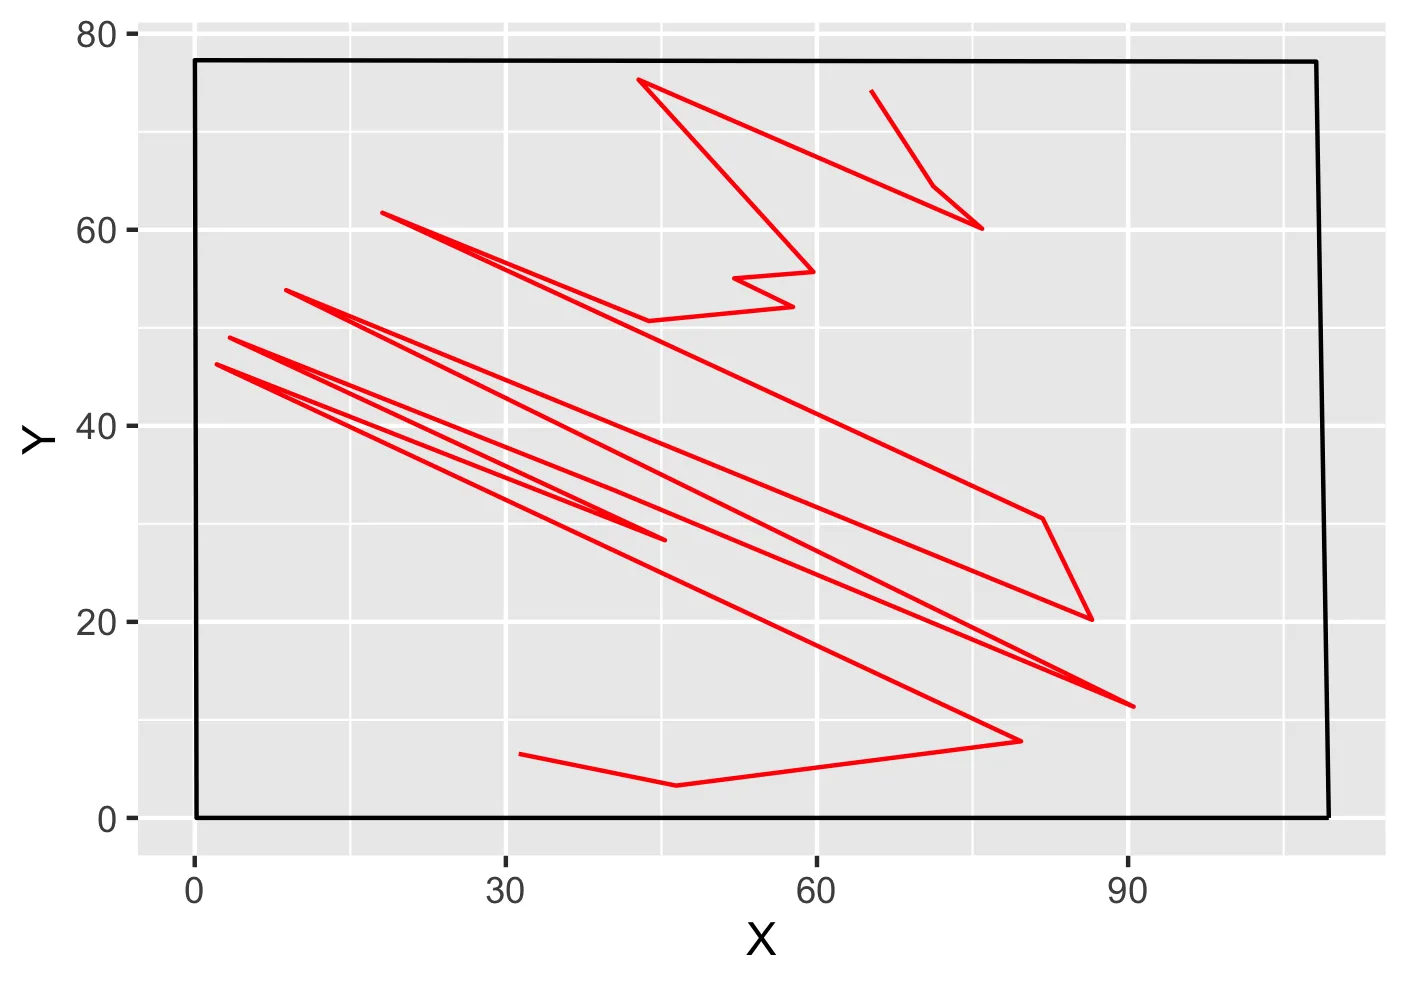
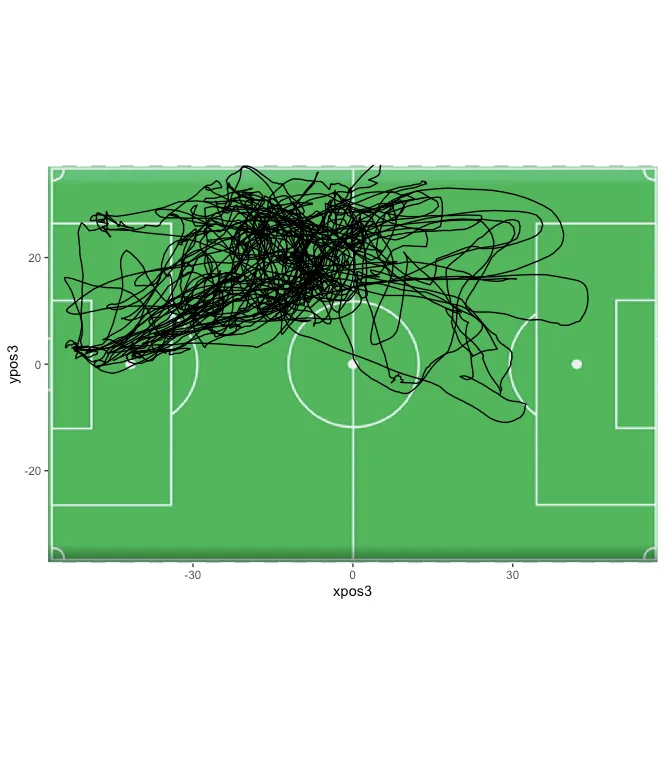
我希望能够将纬度和经度值转换为足球场上的位置x和位置y,并输出类似于下面的图表。

enter image description here

到目前为止,我所尝试的是从Google地图中获取左上角、左下角、右上角和右下角的最大和最小经纬度值。计算出场地的长度和宽度,然后使用以下公式向数据框添加了两列。但这并没有解决我的问题,有什么想法吗?非常感谢。
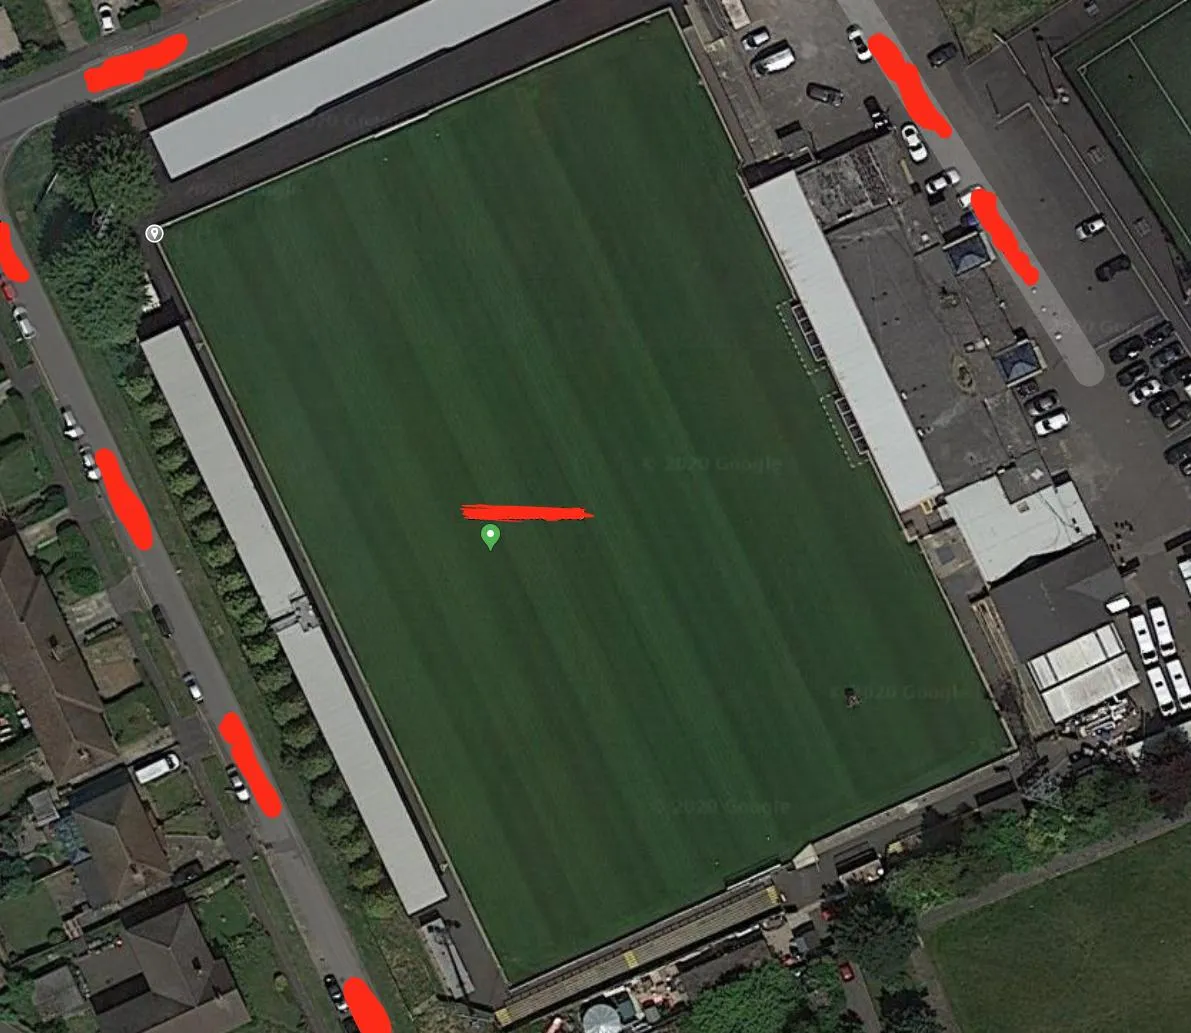
#pitch dimensions taken from google
top_left_lat <- 51.662233
top_left_lon <- -0.273183
top_right_lat <- 51.662518
top_right_lon <- -0.272164
bottom_left_lat <- 51.661337
bottom_left_lon <- -0.272539
bottom_right_lat <- 51.661630
bottom_right_lon <- -0.271528

#calculate pitch length
pitch_length <- acos(cos(deg2rad(90 - top_left_lat)) * cos(deg2rad(90 - bottom_left_lat))
                      + sin(deg2rad(90 - top_left_lat)) * sin(deg2rad(90 - bottom_left_lat))
                      * cos(deg2rad(top_left_lon - bottom_left_lon))) * 6371

pitch_length

#calculate pitch width
pitch_width <- acos(cos(deg2rad(90 - top_left_lat)) * cos(deg2rad(90 - top_right_lat))
                     + sin(deg2rad(90 - top_left_lat)) * sin(deg2rad(90 - top_right_lat))
                     * cos(deg2rad(top_left_lon - top_right_lon))) * 6371

pitch_width


#convert lat lon to pos x and y on a pitch
a <- mutate(a, posX = (pitch_width/360)*(180 + a$Lon))
a <- mutate(a, posY = (pitch_length/180)*(90 - a$Lat))  

如果您拥有场地两个垂直边缘的纬度/经度,您能否通过数学(几何)计算将球员位置的纬度/经度转换为距离这些边缘的距离?因此,基本上是通过三角测量将其转换为x/y坐标? - ulfelder
由于某些原因,当我尝试使用您的纬度/经度值映射音高时,我发现音高在A128的中间。 - Chris
@Chris 抱歉,纬度和经度数值前面缺少减号。 - Fowler Fox
1个回答

1

虽然不是最佳解决方案,但我能够在sf中进行必要的转换:

首先,我将您的音高坐标转换为平面坐标(27700),并随机抽样以表示您的GPS数据:

library(dplyr)
library(sf)
pts <- data.frame(lat = c(top_left_lat,bottom_left_lat, bottom_right_lat, top_right_lat),
           lng = c(top_left_lon,bottom_left_lon, bottom_right_lon, top_right_lon )) %>%
  st_as_sf(coords = c('lng', 'lat'), crs = 4326) %>%
  st_transform(27700)

poly <- pts %>%
  st_union() %>%
  st_convex_hull() 

centroid <- st_centroid(poly)

set.seed(2020)
path <- st_sample(poly, 20) %>%
  st_union() %>%
  st_cast("LINESTRING")


st_transform(poly, 4326) %>% 
  ggplot() +
  geom_sf(fill = NA, col = "black") +
  geom_sf(data = st_transform(path,4326), col = 'red')

initial plot

然后我们计算了俯仰角度并通过sf vignette中的rot函数将数据旋转了该角度:

# get angle of pitch
se <- st_coordinates(pts[1,])
ne <- st_coordinates(pts[2,])
dy <- ne[2] - se[2]
dx <- ne[1] - se[1]

angle = atan(dy/dx) 

# rotate 
rot <- function(a) matrix(c(cos(a), sin(a), -sin(a), cos(a)), 2, 2) 

poly2 <- (poly - centroid) * rot(angle) + centroid
path2 <- (path -  centroid) * rot(angle)+ centroid

最后将其翻译为底部左侧位于(0,0):
# translate to 0,0
xmin <- st_bbox(poly2)[1]
ymin <- st_bbox(poly2)[2]

pitch <- poly2 - c(xmin, ymin)
positions <- path2 - c(xmin, ymin)

## fetch the x,y coordinates:
position_xy <- positions %>%
  st_coordinates() %>%
  as.data.frame()

pitch_xy <- pitch %>%
  st_cast("LINESTRING") %>%
  st_coordinates %>%
  as.data.frame

position_xy %>%
  ggplot() +
  geom_path(aes(x = X, y= Y), col= 'red') +
  geom_path(data = pitch_xy ,aes(x = X, y = Y)) 

enter image description here


如果您想要像您的图像一样将原点放在场地中心,请在定义“poly2”和“path2”时不要添加质心,并跳过平移步骤。 - Chris

网页内容由stack overflow 提供, 点击上面的
可以查看英文原文,
原文链接