在R中使用ggplot2创建小提琴图,涉及多个数据列

3
我是一名新手,正在尝试使用R制作各种物种在每个采样深度的物种计数数据的小提琴图。 数据如下:
    Depth Cd Cf Cl
1  3.6576  0  2  0
2  4.0000  2 13  0
3  4.2672  0  0  0
4 13.1064  0  2  0
5 14.0000  3 17 10
6 17.0000  0  0  0

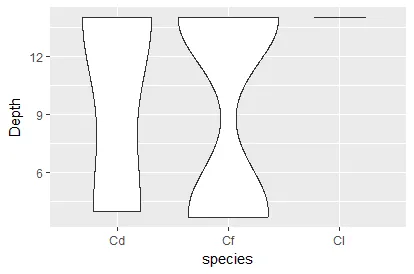
在第一列中有深度,第二至五列是不同物种的数据。我正在尝试使用R中的ggplot2,但假设数据的组织方式不能被ggplot2使用。理想情况下,我希望深度成为y轴,物种分布在x轴上,并且每个物种都有一个小提琴图。谢谢您的帮助。

2个回答

3

首先重新整理您的数据:

library(tidyverse)

my_dat2 <- my_dat %>% 
  gather(species, val, -Depth) %>% 
  slice(rep(row_number(), val)) %>% 
  select(-val)

ggplot(my_dat2, aes(species, Depth)) +
  geom_violin()

enter image description here

请注意,Cl 只有一行,因为您只有一个深度。

谢谢各位在此事上的帮忙。这看起来很好,完全回答了我的问题。再次感谢!祝好,- Alexander 刚刚 编辑 删除 - Alexander

2

就如你已经猜到的那样,你需要重新构造数据。使用 tidyr::gather 可以将格式从“宽”转换为“长”,这对于在 x 轴上绘制物种是必要的。此外,你需要扩展计数数据,可以使用 slice 来实现。


library(tidyverse)

zz <- "Depth Cd Cf Cl
1  3.6576  0  2  0
2  4.0000  2 13  0
3  4.2672  0  0  0
4 13.1064  0  2  0
5 14.0000  3 17 10
6 17.0000  0  0  0"

my_dat <- read.table(text = zz, header = T)

my_dat %>% 
  gather(species, val, -Depth) %>% 
  slice(rep(row_number(), val)) %>%
  ggplot(aes(species, Depth)) +
  geom_violin(adjust = .5)


谢谢您的帮助。您的方法是有效的,但所有小提琴看起来都一模一样。由于每个物种的计数数据不同,它们应该看起来不同。您有什么建议吗? - Alexander
@Alexander Axeman是正确的,我忘记扩展计数数据了。 - Thomas K
谢谢大家对此的帮助。这看起来很棒,完全回答了我的问题。再次感谢!问候, - Alexander

网页内容由stack overflow 提供, 点击上面的
可以查看英文原文,
原文链接