ggplot2 更改每个单独面板的坐标轴限制

25
library(tidyverse)
ggplot(mpg, aes(displ, cty)) + 
  geom_point() + 
  facet_grid(rows = vars(drv), scales = "free")

上面的 ggplot 代码由三个面板 4fr 组成。我希望每个面板的 y 轴限制如下:

Panel y-min y-max breaks
----- ----- ----- ------
4     5     25    5
f     0     40    10
r     10    20    2

我该如何修改我的代码来实现这个目标?不确定是使用scale_y_continuous还是coord_cartesian,或者两者的组合更为合适。


2
我认为一般的方法是制作单独的图表,然后将它们拼接在一起,而不是使用 facets。关于如何做到这一点的一些想法可以在这里和这里看到。 - aosmith
1
我认为你提出的建议(scale_y_continuouscoord_cartesian)都不适用于面板。如果这些是数据比例的扩展,我也通过向数据集添加虚假数据并确保在定义比例时考虑它们但不绘制它们来完成了这个过程。还可以使用breaks()函数来进行hack,通过检测当前正在考虑哪个子图... - Ben Bolker
1
@BenBolker OP正在使用ggplot2内置的数据集mpg - Calum You
哎呀! - Ben Bolker
这个问题可以通过设置 scale_y_continuous(breaks=my_breaks,expand=expand_scale(mult=c(0,.1))) 来解决,其中 my_break 函数设置了断点,而 expand_scale 则设置了限制。 - pengchy
5个回答

46

这是一个长期以来的功能请求(参见,例如,200920112016),由一个名为 facetscales 的单独软件包解决。

devtools::install_github("zeehio/facetscales")
library(g)
library(facetscales)
scales_y <- list(
  `4` = scale_y_continuous(limits = c(5, 25), breaks = seq(5, 25, 5)),
  `f` = scale_y_continuous(limits = c(0, 40), breaks = seq(0, 40, 10)),
  `r` = scale_y_continuous(limits = c(10, 20), breaks = seq(10, 20, 2))
)
ggplot(mpg, aes(displ, cty)) + 
  geom_point() + 
  facet_grid_sc(rows = vars(drv), scales = list(y = scales_y))
如果每个facet的参数都存储在dataframe facet_params中,我们可以“运用语言”来创建scale_y

enter image description here

library(tidyverse)
facet_params <- read_table("drv y_min y_max breaks
4     5     25    5
f     0     40    10
r     10    20    2")

scales_y <- facet_params %>% 
  str_glue_data(
    "`{drv}` = scale_y_continuous(limits = c({y_min}, {y_max}), ", 
                "breaks = seq({y_min}, {y_max}, {breaks}))") %>%
  str_flatten(", ") %>% 
  str_c("list(", ., ")") %>% 
  parse(text = .) %>% 
  eval()

1
现在应该接受这个答案...虽然Ben Bolker的答案也很聪明。 - qdread
转念一想,我认为geom_blank()可能是一种更灵活的方法,因为似乎facetscales包不支持facet_wrap,只支持facet_grid - qdread
1
收到一个消息,facetscales 可用于当前的 R4.1.0 版本... 真是遗憾。 - Markm0705
1
非常感谢这个。在谷歌上搜索解决评审人员最后的需求时,我发现了这个并且节省了数小时的重构代码。对我的原始代码进行了一些简单的编辑,图像就如所需那样。巨大的赞! - Stephen Henderson
4
很遗憾,这里引用的软件包现在已经存档了。但是ggh4x软件包将允许相同的操作-https://dev59.com/XXcPtIcB2Jgan1znHzzk#73006975 - EcologyTom
使用facet_wrap和scales = "free"在ggplot2中设置单独的轴限制 - tjebo

17

前置条件

定义原始图形并确定每个面的y轴所需参数:

library(ggplot2)
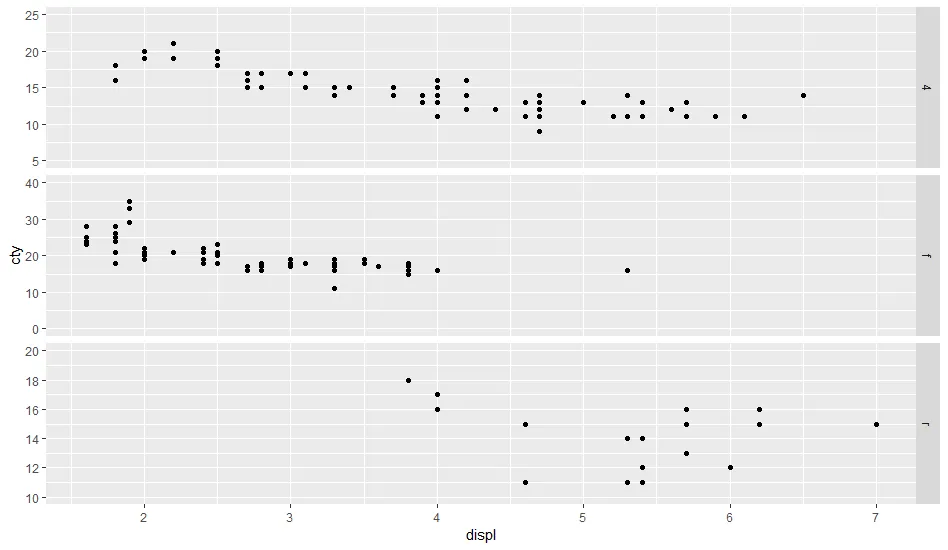
g0 <- ggplot(mpg, aes(displ, cty)) + 
    geom_point() + 
    facet_grid(rows = vars(drv), scales = "free")

facet_bounds <- read.table(header=TRUE,
text=                           
"drv ymin ymax breaks
4     5     25    5
f     0     40    10
r     10    20    2",
stringsAsFactors=FALSE)

版本1:放入虚假数据点

这不符合breaks规格,但它能正确获取边界:

定义一个新的数据框,其中包括每个drv的最小/最大值:

ff <- with(facet_bounds,
           data.frame(cty=c(ymin,ymax),
                      drv=c(drv,drv)))

将它们添加到图表中(由于xNA,所以它们不会被绘制,但仍然用于定义比例尺)

g0 + geom_point(data=ff,x=NA)

这与expand_limits()的功能类似,不同的是该函数适用于“所有面板或所有图形”。

版本2:检测您所在的面板

这很丑陋,并取决于每个组具有唯一范围。

library(dplyr)
## compute limits for each group
lims <- (mpg
    %>% group_by(drv)
    %>% summarise(ymin=min(cty),ymax=max(cty))
)

休息函数:找出与给定限制集对应的组...

bfun <- function(limits) {
    grp <- which(lims$ymin==limits[1] & lims$ymax==limits[2])
    bb <- facet_bounds[grp,]
    pp <- pretty(c(bb$ymin,bb$ymax),n=bb$breaks)
    return(pp)
}
g0 + scale_y_continuous(breaks=bfun, expand=expand_scale(0,0))

这里的另一个问题是我们不得不设置expand_scale(0,0),以使限制与组限制完全相等,而这可能不是您想要的绘图方式...

如果breaks()函数能够以某种方式传递有关当前正在计算哪个面板的信息,那就太好了...


4
使用 geom_blank() 可以更加简洁地实现控制坐标轴的目的,而无需通过绘制不可见点来实现。 - crsh

5
我想在 facetscales 中使用对数刻度,但遇到了一些困难。
结果我必须在两个位置指定 log10:
scales_x <- list(
  "B" = scale_x_log10(limits=c(0.1, 10), breaks=c(0.1, 1, 10)),
  "C" = scale_x_log10(limits=c(0.008, 1), breaks=c(0.01, 0.1, 1)),
  "E" = scale_x_log10(limits=c(0.01, 1), breaks=c(0.01, 0.1, 1)),
  "R" = scale_x_log10(limits=c(0.01, 1), breaks=c(0.01, 0.1, 1))
)

在这个情节中。
ggplot(...) + facet_grid_sc(...) +  scale_x_log10()

4
另一个更近期的选择是使用ggh4x包,通过ggh4x::facetted_pos_scales允许单独指定每个面板的位置比例:
library(ggplot2)
library(ggh4x)

df_scales <- data.frame(
  Panel = c("4", "f", "g"),
  ymin = c(5, 0, 10),
  ymax = c(25, 40, 20),
  n = c(5, 10, 2)
)
df_scales <- split(df_scales, df_scales$Panel)

scales <- lapply(df_scales, function(x) {
  scale_y_continuous(limits = c(x$ymin, x$ymax), n.breaks = x$n)
})

ggplot(mpg, aes(displ, cty)) +
  geom_point() +
  facet_grid(rows = vars(drv), scales = "free") +
  ggh4x::facetted_pos_scales(
    y = scales
  )


3

很不幸,据我所知(可能我错了),上述提到的方法不能帮助您缩小分面轴。例如,这是我的工作中的一张图表,其中包含匿名数据:

enter image description here

在两个分面中(右侧列),一个或两个数据点的置信区间会使得该分面的域范围急剧变化,从而使主体数据的总体趋势难以辨认。 我需要缩小这些轴。

我编写了一个函数scale_individual_facet_y_axes,它非常粗略地完成了这个任务。 它是一个独立的函数,接受两个参数:plot 是 ggplot 函数输出的 ggproto 对象,ylims 是一个元组列表,每个元组对应于一个特定分面的 y 轴。 如果您想让特定分面的轴保持不变,请在 ylims 列表中使用 NULL 值来表示该分面的元素。

例如:

plot = 
  data %>% 
  ggplot(aes(...)) +
  geom_thing() + 
  # ... construct your ggplot object as normal, and save it to a variable
  geom_whatever()

ylims = list(NULL, c(-20, 100), NULL, c(0, 120))

  
scale_inidividual_facet_y_axes(plot, ylims = ylims)

这将产生以下结果: enter image description here 如您所见,右侧列的轴已被修改,而左侧列保持原样。
这种方法有一个明显的问题:它发生在图形绘制之前,因此落在新轴范围之外的数据将不再绘制。您可以在右侧列中看到这一点,在那里置信区间带的极值不再绘制,因为它们超出了强制性的轴限制。
将来我可能会找到一种方法来解决这个问题,但现在就是这样。
函数代码:
#' Scale individual facet y-axes
#' 
#' 
#' VERY hacky method of imposing facet specific y-axis limits on plots made with facet_wrap
#' Briefly, this function alters an internal function within the ggproto object, a function which is called to find any limits imposed on the axes of the plot. 
#' We wrap that function in a function of our own, one which intercepts the return value and modifies it with the axis limits we've specified the parent call 
#' 
#' I MAKE NO CLAIMS TO THE STABILITY OF THIS FUNCTION
#' 
#'
#' @param plot The ggproto object to be modified
#' @param ylims A list of tuples specifying the y-axis limits of the individual facets of the plot. A NULL value in place of a tuple will indicate that the plot should draw that facet as normal (i.e. no axis modification)
#'
#' @return The original plot, with facet y-axes modified as specified
#' @export
#'
#' @examples 
#' Not intended to be added to a ggproto call list. 
#' This is a standalone function which accepts a ggproto object and modifies it directly, e.g.
#' 
#' YES. GOOD: 
#' ======================================
#' plot = ggplot(data, aes(...)) + 
#'   geom_whatever() + 
#'   geom_thing()
#'   
#' scale_individual_facet_y_axes(plot, ylims)
#' ======================================
#' 
#' NO. BAD:
#' ======================================
#' ggplot(data, aes(...)) + 
#'   geom_whatever() + 
#'   geom_thing() + 
#'   scale_individual_facet_y_axes(ylims)
#' ======================================
#' 
scale_inidividual_facet_y_axes = function(plot, ylims) {
  init_scales_orig = plot$facet$init_scales
  
  init_scales_new = function(...) {
    r = init_scales_orig(...)
    # Extract the Y Scale Limits
    y = r$y
    # If this is not the y axis, then return the original values
    if(is.null(y)) return(r)
    # If these are the y axis limits, then we iterate over them, replacing them as specified by our ylims parameter
    for (i in seq(1, length(y))) {
      ylim = ylims[[i]]
      if(!is.null(ylim)) {
        y[[i]]$limits = ylim
      }
    }
    # Now we reattach the modified Y axis limit list to the original return object
    r$y = y
    return(r)
  }
  
  plot$facet$init_scales = init_scales_new
  
  return(plot)
}


非常感谢,非常有帮助。这个在使用facet_wrap时有效,但在使用facet_grid时无效。 - undefined

网页内容由stack overflow 提供, 点击上面的
可以查看英文原文,
原文链接