我的数据有三列,第一列是日期。我想要绘制第二列,但会根据第三列的值更改其颜色。
If 3rd column is:
     Positive:  Black
     Negative:  Red
     zero:      Yellow
这是我正在尝试的内容:
set palette model RGB defined ( 0 'yellow', 1 'red', 2 'black' )
plot "output2.txt" u 1:2:( $3 < 0 ? 1 : ( $3 > 0 ? 2 : 0 ) )  w lines palette axes x1y1
尽管第三列有负数,但我从未获得红色。
编辑1
有时它可以正常工作,但这是一个不起作用的情况:
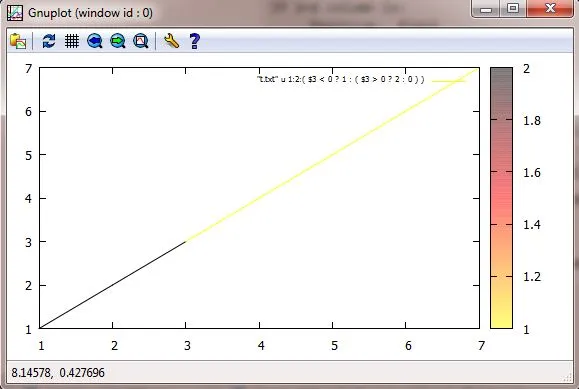
$ cat t.txt
1 1 1000000
2 2 1000000
3 3 1000000
4 4 -1000000
5 5 -1000000
6 6 -1000000
7 7 -1000000
这是我的gnu脚本:
$ cat test.gnu
set terminal wxt size 1500,900
set style fill transparent solid 0.50 noborder
set key font ",6"
set palette model RGB defined ( 0 'yellow', 1 'red', 2 'black' )
plot "t.txt" u 1:2:( $3 < 0 ? 1 : ( $3 > 0 ? 2 : 0 ) )  w lines palette axes x1y1
我在Cygwin中是这样调用它的:
~/wgnuplot -e "load \"test.gnu\"" -persist
这是结果(黄色线应该变成红色):