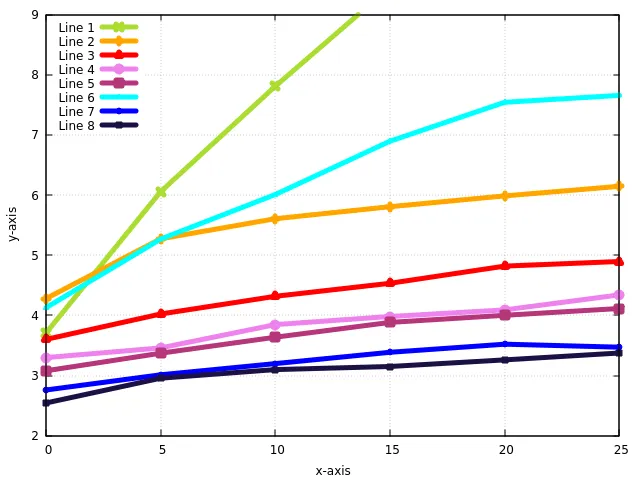
我正在尝试使用Gnuplot创建线图。每条线都用不同的颜色表示。我想要的是键与线的颜色相同。这是我现在拥有的,当前版本。是否可以将文本“Line 2”设置为橙色,“Line 3”设置为红色等?
这是我在gp文件中编写的内容:
这是我在gp文件中编写的内容:
set xlabel'x-axis'; \
set xrange[0:25];\
set ylabel 'y-axis';\
set yrange [2:9];\
set key left top;
p   'test.dat' using 1:2 w linespoints lw 5 lc rgb '#aadc32' pt 17 title 'Line 1' ,\
'test.dat' using 1:9 w linespoints lw 5 lc 'orange' lt 1 title 'Line 2',\
'test.dat' using 1:6 w linespoints lw 5 lc 'red' lt 8 title 'Line 3',\
'test.dat' using 1:7 w linespoints lw 5 lc 'violet' pt 6 title 'Line 4',\'test.dat' using 1:8 w linespoints lw 5 lc rgb '#b5367a' pt 19 title 'Line 5',\
'test.dat' using 1:3 w linespoints lw 5 lc 'cyan' pt 9 title'Line 6',\
'test.dat' using 1:4 w linespoints lw 5 lc 'blue' lt 9 title 'Line 7',\
'test.dat' using 1:10 w linespoints lw 5 lc rgb '#1c1044' lt 5 title 'Line 8',\
Thank you so much.