我正在使用matplotlib中的basemap绘制地图。数据分布在全球各地,但我只想保留大陆上的所有数据并删除海洋中的数据。是否有一种方法可以过滤数据,或者重新绘制海洋以覆盖数据?
5个回答
6
is_land() 会循环所有多边形来检查它是否为陆地。对于大数据量,速度非常慢。您可以使用 matplotlib 的 points_inside_poly() 快速检查点数组。以下是代码。它不会检查 lakepolygons,如果您想要移除湖泊中的点,可以自行添加。
在我的电脑上,检查100000个点需要2.7秒。如果您想要更快的速度,可以将多边形转换为位图,但这有点困难。如果下面的代码对您的数据集来说速度不够快,请告诉我。
from mpl_toolkits.basemap import Basemap
import numpy as np
import matplotlib.pyplot as plt
import matplotlib.nxutils as nx

def points_in_polys(points, polys):
    result = []
    for poly in polys:
        mask = nx.points_inside_poly(points, poly)
        result.extend(points[mask])
        points = points[~mask]
    return np.array(result)

points = np.random.randint(0, 90, size=(100000, 2))
m = Basemap(projection='moll',lon_0=0,resolution='c')
m.drawcoastlines()
m.fillcontinents(color='coral',lake_color='aqua')
x, y = m(points[:,0], points[:,1])
loc = np.c_[x, y]
polys = [p.boundary for p in m.landpolygons]
land_loc = points_in_polys(loc, polys)
m.plot(land_loc[:, 0], land_loc[:, 1],'ro')
plt.show()
- HYRY
2
6
在matplotlib.basemap中有一个方法: is_land(xpt, ypt)
如果给定的x,y点(投影坐标)在陆地上,则返回True,否则返回False。陆地的定义基于与类实例相关联的GSHHS海岸线多边形。位于陆地区域内的湖泊上的点不被视为陆地点。
有关更多信息,请参见此处。
- Timothy
1
谢谢,这正是我在寻找的。但是,当我使用
is_land 时遇到了一个问题。它在这里:http://stackoverflow.com/q/13800056/1819734。 - ZYX5
我正在回答这个问题,然后有人告诉我最好把我的答案发到这里。基本上,我的解决方案提取用于绘制
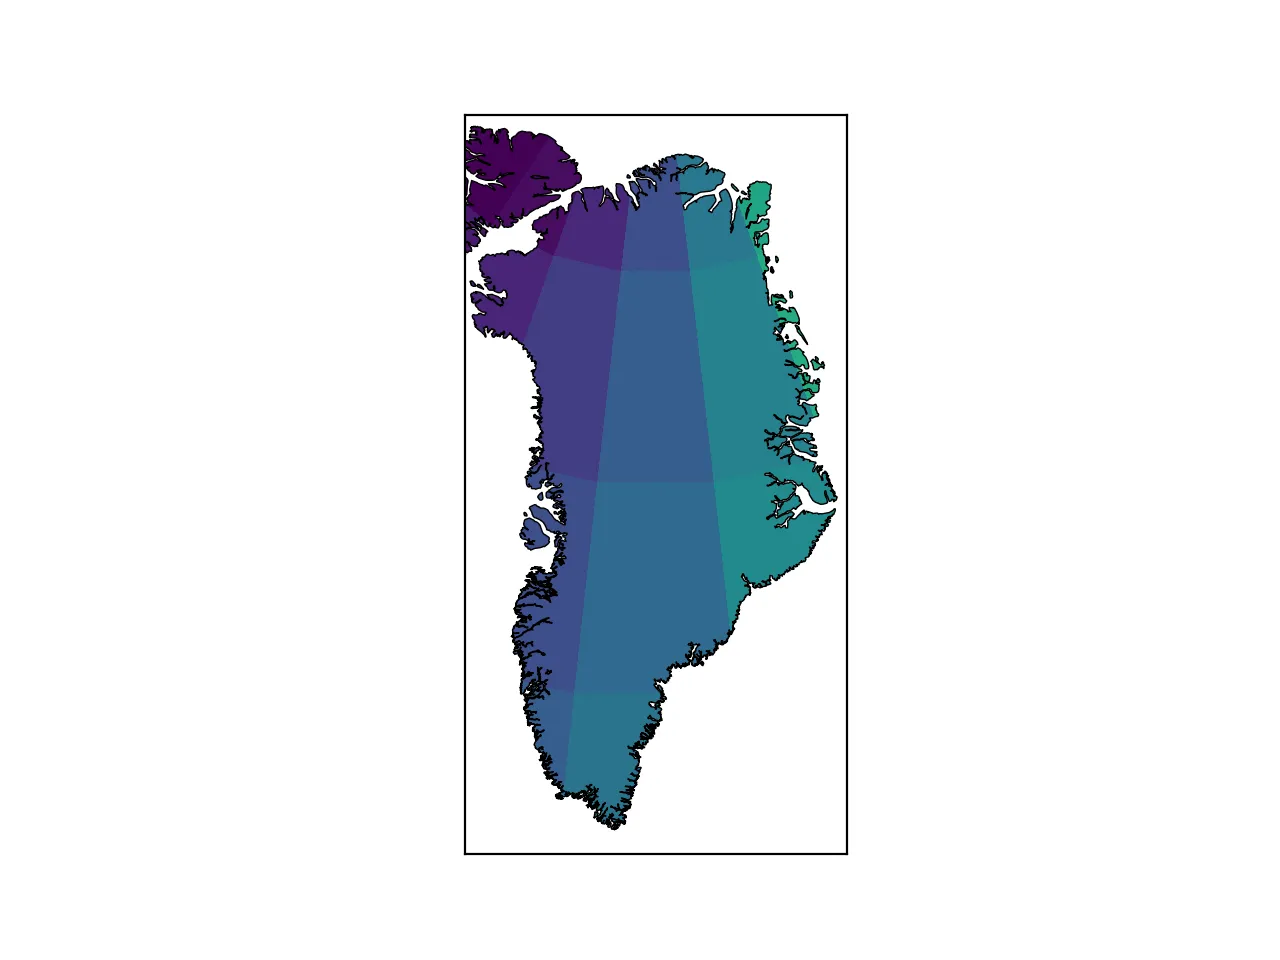
这将生成以下图表:
Basemap实例海岸线的多边形,并将这些多边形与地图轮廓结合起来,生成一个matplotlib.PathPatch,覆盖地图的海洋区域。
如果数据粗糙且不需要插值,则这尤其有用。在这种情况下,使用maskoceans会产生非常粗糙的海岸线轮廓,效果不太好。
这是我针对另一个问题发布的相同示例答案:
from matplotlib import pyplot as plt
from mpl_toolkits import basemap as bm
from matplotlib import colors
import numpy as np
import numpy.ma as ma
from matplotlib.patches import Path, PathPatch

fig, ax = plt.subplots()

lon_0 = 319
lat_0 = 72

##some fake data
lons = np.linspace(lon_0-60,lon_0+60,10)
lats = np.linspace(lat_0-15,lat_0+15,5)
lon, lat = np.meshgrid(lons,lats)
TOPO = np.sin(np.pi*lon/180)*np.exp(lat/90)

m = bm.Basemap(resolution='i',projection='laea', width=1500000, height=2900000, lat_ts=60, lat_0=lat_0, lon_0=lon_0, ax = ax)
m.drawcoastlines(linewidth=0.5)

x,y = m(lon,lat)
pcol = ax.pcolormesh(x,y,TOPO)

##getting the limits of the map:
x0,x1 = ax.get_xlim()
y0,y1 = ax.get_ylim()
map_edges = np.array([[x0,y0],[x1,y0],[x1,y1],[x0,y1]])

##getting all polygons used to draw the coastlines of the map
polys = [p.boundary for p in m.landpolygons]

##combining with map edges
polys = [map_edges]+polys[:]

##creating a PathPatch
codes = [
    [Path.MOVETO] + [Path.LINETO for p in p[1:]]
    for p in polys
]
polys_lin = [v for p in polys for v in p]
codes_lin = [c for cs in codes for c in cs]
path = Path(polys_lin, codes_lin)
patch = PathPatch(path,facecolor='white', lw=0)

##masking the data:
ax.add_patch(patch)

plt.show()
这将生成以下图表:
- Thomas Kühn
2
在我的情况下完全相反,我想掩盖陆地并显示海洋中的数据。有什么可以改变以实现这一效果? - gfdsal
希望你能给予协助。 - gfdsal
5
HYRY的答案在新版本的matplotlib上无法使用(nxutils已被弃用)。我制作了一个新版本,可以正常工作:
from mpl_toolkits.basemap import Basemap
import matplotlib.pyplot as plt
from matplotlib.path import Path
import numpy as np

map = Basemap(projection='cyl', resolution='c')

lons = [0., 0., 16., 76.]
lats = [0., 41., 19., 51.]

x, y = map(lons, lats)

locations = np.c_[x, y]

polygons = [Path(p.boundary) for p in map.landpolygons]

result = np.zeros(len(locations), dtype=bool)

for polygon in polygons:

    result += np.array(polygon.contains_points(locations))

print result
- Roger Veciana
5
最简单的方法是使用basemap的maskoceans。
如果对于每个纬度和经度,您都有数据并且想要使用等高线: 在网格化和插值之后:
如果对于每个纬度和经度,您都有数据并且想要使用等高线: 在网格化和插值之后:
from scipy.interpolate import griddata as gd
from mpl_toolkits.basemap import Basemap, cm, maskoceans
xi, yi = np.meshgrid(xi, yi)
zi = gd((mlon, mlat),
            scores,
            (xi, yi),
            method=grid_interpolation_method)
#mask points on ocean
data = maskoceans(xi, yi, zi)
con = m.contourf(xi, yi, data, cmap=cm.GMT_red2green)
#note instead of zi we have data now.
更新(比in_land或in_polygon解决方案快得多):
如果每个纬度和经度都没有数据,并且您只想在陆地上散布点:
x, y = m(lons, lats)
samples = len(lons)
ocean = maskoceans(lons, lats, datain=np.arange(samples),
                   resolution='i')
ocean_samples = np.ma.count_masked(ocean)
print('{0} of {1} points in ocean'.format(ocean_samples, samples))
m.scatter(x[~ocean.mask], y[~ocean.mask], marker='.', color=colors[~ocean.mask], s=1)
m.drawcountries()
m.drawcoastlines(linewidth=0.7)
plt.savefig('a.png')
- Ash
网页内容由stack overflow 提供, 点击上面的可以查看英文原文,
原文链接
原文链接
points_inside_poly(如果我没记错的话,整个nxutils)在mpl 1.2中已经被弃用了,但它也可以使用新方法(目前无法记住新方法是什么,但弃用警告会提示它)。 - bmu