在R Shiny中为DT表格添加垂直和水平滚动条

17
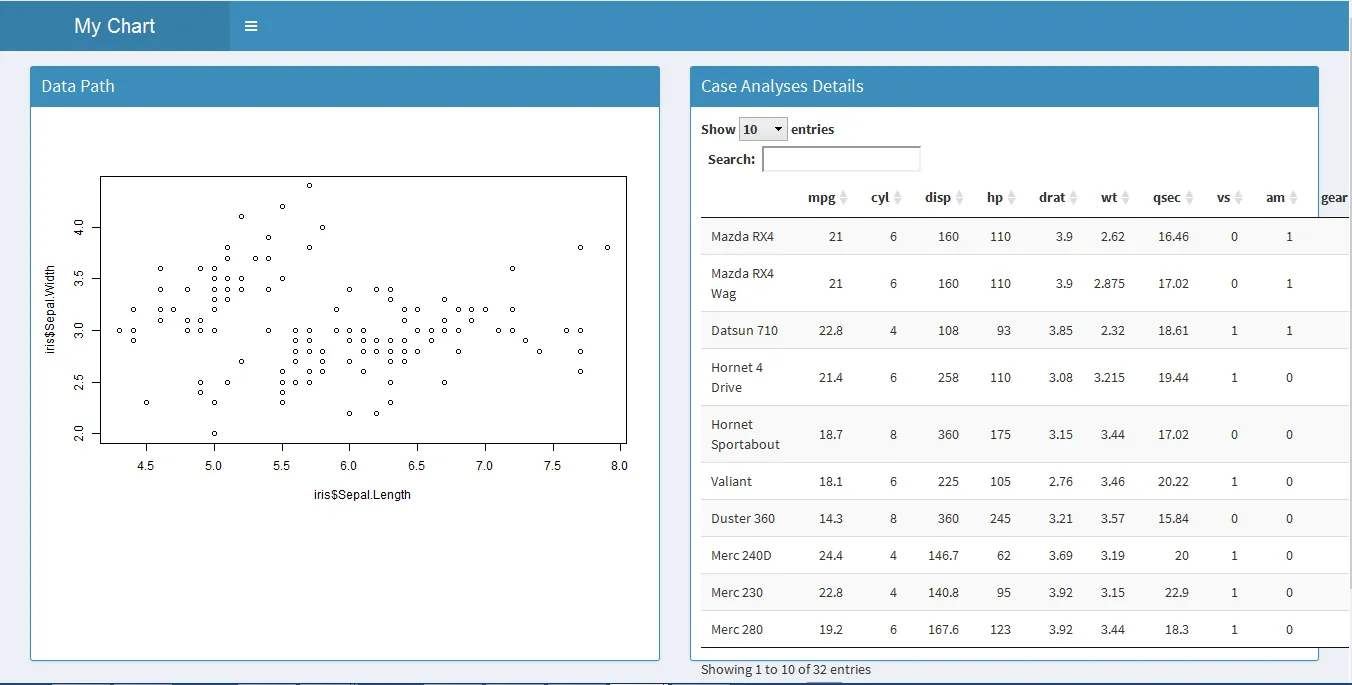
请检查右侧的数据表“案例分析详情”。我想把数据表放在框内,使其从框的右侧和底部对齐,这样我们就可以为DT添加水平和垂直滚动条,以跨越超出框的行。
## app.R ##
library(shiny)
library(shinydashboard)
library(DT)
ui <- dashboardPage(
dashboardHeader(title = "My Chart"),
dashboardSidebar(
width = 0
),
dashboardBody(
box(title = "Data Path", status = "primary",height = "595" ,solidHeader = T,
    plotOutput("trace_plot")),
box( title = "Case Analyses Details", status = "primary", height = 
"595",width = "6",solidHeader = T, 
     div(DT::dataTableOutput("trace_table",width = 220)))
))
server <- function(input, output) 
{ 
#Plot for Trace Explorer
output$trace_plot <- renderPlot({
plot(iris$Sepal.Length,iris$Sepal.Width)
})
output$trace_table <- renderDataTable({
mtcars
})
}
shinyApp(ui, server)

MTCARS CAPTURE

2个回答

29
这样可以吗?(请注意,此处为已翻译后的文本)
rm(list = ls())
## app.R ##
library(shiny)
library(shinydashboard)
library(DT)
ui <- dashboardPage(
  dashboardHeader(title = "My Chart"),
  dashboardSidebar(
    width = 0
  ),
  dashboardBody(
    box(title = "Data Path", status = "primary",height = "595" ,solidHeader = T,
        plotOutput("trace_plot")),
    box( title = "Case Analyses Details", status = "primary", height = 
           "595",width = "6",solidHeader = T, 
         column(width = 12,
                DT::dataTableOutput("trace_table"),style = "height:500px; overflow-y: scroll;overflow-x: scroll;"
         )
    )))
server <- function(input, output) { 
  #Plot for Trace Explorer
  output$trace_plot <- renderPlot({
    plot(iris$Sepal.Length,iris$Sepal.Width)
  })
  output$trace_table <- renderDataTable({

    datatable(cbind(mtcars,mtcars), options = list(paging = FALSE))

  })
}
shinyApp(ui, server)

enter image description here


嗨@Pork Chop...为了实现水平滚动,可以添加以下内容:
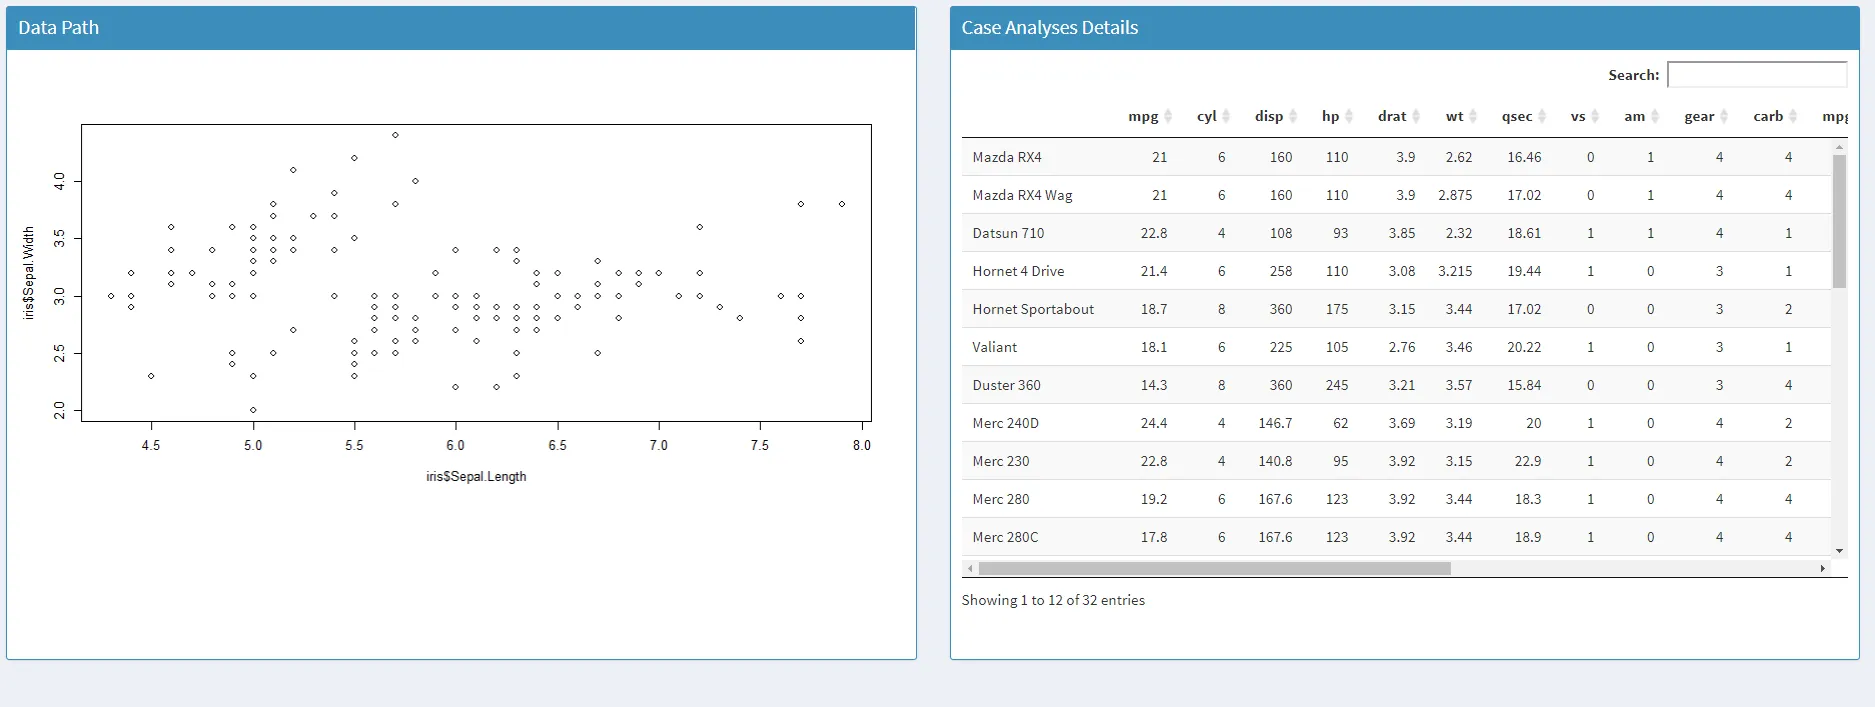
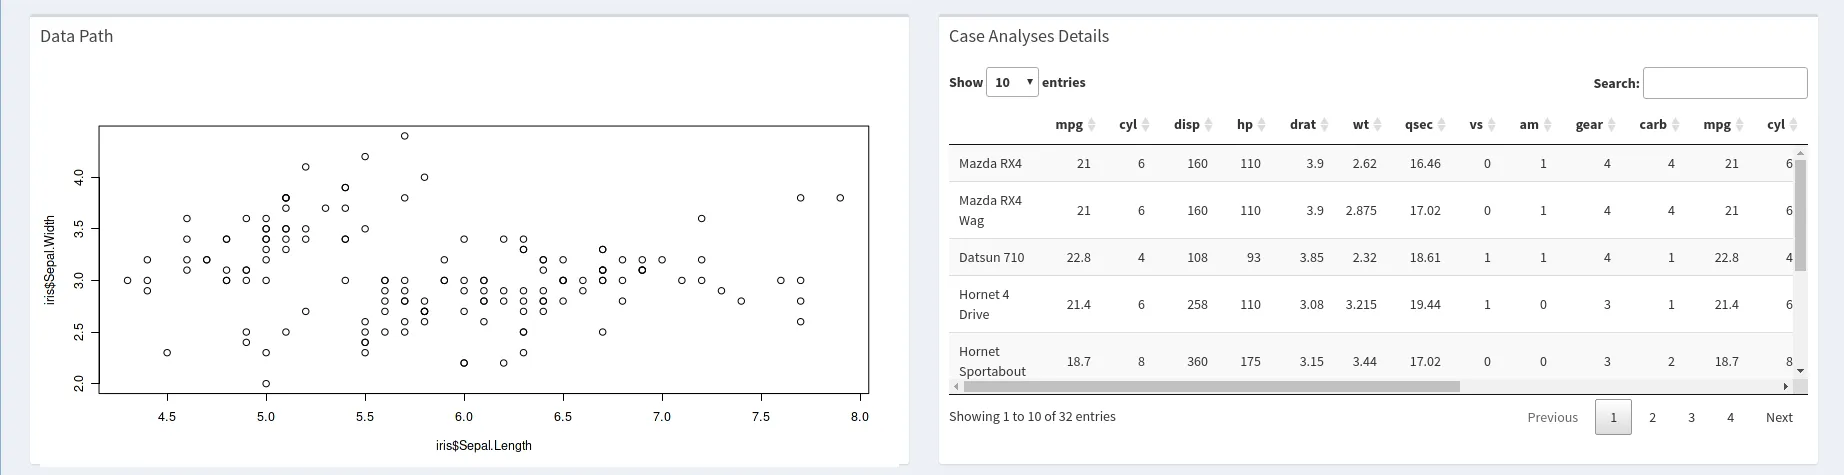
div(style = 'overflow-x: scroll',DT::dataTableOutput("trace_table",width = "100%")) - Subhasish1315
@AshminKaul 请看上面 - Pork Chop
哦,是的,我知道这个。我正在测试并需要查看它如何处理具有许多列的数据集。 - Pork Chop
@PorkChop,请帮我解决这个带滑块的DT问题,链接在这里:https://stackoverflow.com/questions/47713721/handling-and-optimizing-a-range-slider-in-r - Ashmin Kaul
嗨@Ashmin,最后三列无法看到的问题解决了吗?我正在处理R闪亮的滚动条,并遇到了同样的问题。 - YihanBao
显示剩余4条评论

3

这是一个老问题,但我们也可以使用专用选项scrollXscrollY来为datatable添加滚动条:

library(shiny)
library(shinydashboard)
library(DT)

ui <- dashboardPage(
  dashboardHeader(title = "My Chart"),
  dashboardSidebar(
    width = 0
  ),
  dashboardBody(
    box(title = "Data Path", height = 450,
        plotOutput("trace_plot")),
    
    box(title = "Case Analyses Details", height = 450,
        DTOutput("trace_table")
    ))
)

server <- function(input, output) { 
  output$trace_plot <- renderPlot({
    plot(iris$Sepal.Length,iris$Sepal.Width)
  })
  output$trace_table <- renderDataTable({
    datatable(
      cbind(mtcars, mtcars),
      options = list(
        scrollX = TRUE,
        scrollY = "250px"
      )        
    )
  })
}
shinyApp(ui, server)

enter image description here


网页内容由stack overflow 提供, 点击上面的
可以查看英文原文,
原文链接