我正试图给grid.arrange图表添加脚注。我在这个可重复的例子中展示了我的想法:
library(ggplot2)
library(gridExtra)
library(grid)
library(gtable)
summary(anscombe)
p1 <- ggplot(anscombe) + geom_point(aes(x1, y1), color = "darkorange", size = 3) + theme_bw()
p2 <- ggplot(anscombe) + geom_point(aes(x2, y2), color = "darkorange", size = 3) + theme_bw()
p3 <- ggplot(anscombe) + geom_point(aes(x3, y3), color = "darkorange", size = 3) + theme_bw()
p4 <- ggplot(anscombe) + geom_point(aes(x4, y4), color = "darkorange", size = 3) + theme_bw()
title <- textGrob("Some title",
gp=gpar(fontsize=20,fontface=2))
source1<- textGrob("Source: https://rpubs.com/neilfws/91339",
hjust=0,x=0,y=1,
gp=gpar(fontsize=10,fontface=3))
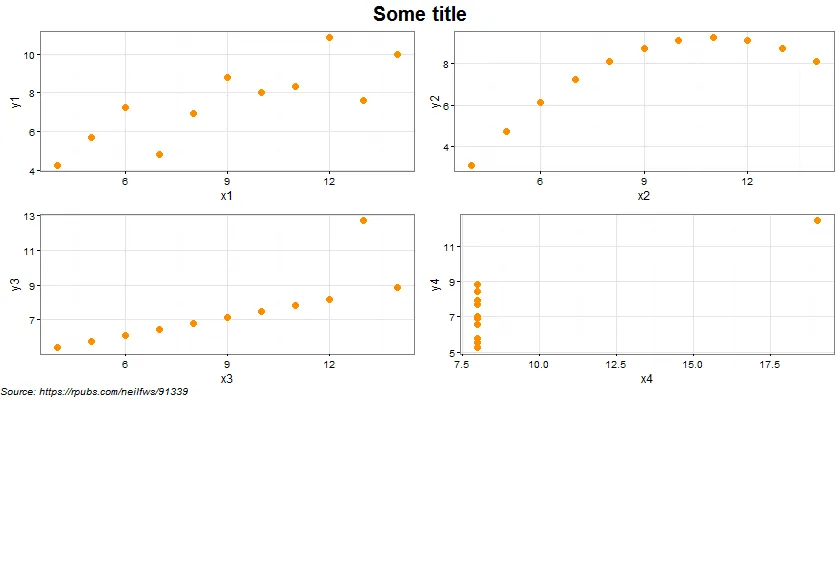
grid.arrange(arrangeGrob(p1,p2,p3,p4, ncol=2, sub = source1), top = title)
这段代码生成了下面那张图片:
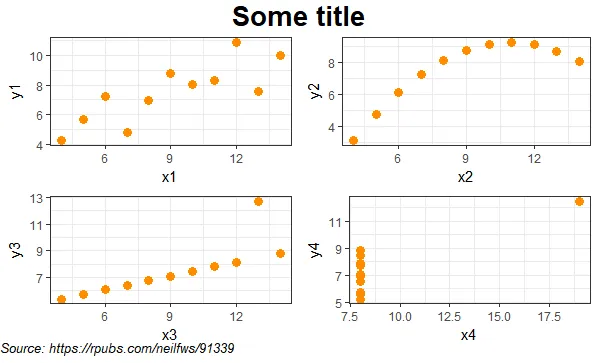
grid.arrange(p1,p2,p3,p4, ncol=2, bottom = source1, top = title)也可以。 - Josh O'Brien