这里有两个简单的png文件。
value <- c(0, 1, 20, 3, 3, 0, 0, 5, 2, 5, 2, 7)
names.arg =c("0-15","15-19","20-24","25-29","30-34",
             "35-39","40-44","45- 49","50-54","55-59","60-64","65 Jahre oder Älter")
df <- data.frame(names.arg = names.arg, value = value)

p1 <- ggplot(df, aes(x=names.arg, y=value)) + geom_bar(stat = "identity")
save(p1, file = "p1.png")

value2 <- c(0, 1, 20, 3, 3, 0, 0, 5, 2, 5, 2, 7)
names2 =c("0-15","15-19","20-24","25-29","30-34",
             "35-39","40-44","45- 49","50-54","55-59","60-64","65 Jahre oder Älter")
df2 <- data.frame(names = names2, value = value2)

p2 <- ggplot(df2, aes(x=names, y=value)) + geom_bar(stat = "identity", fill = "red")
save(p2, file = "p2.png")
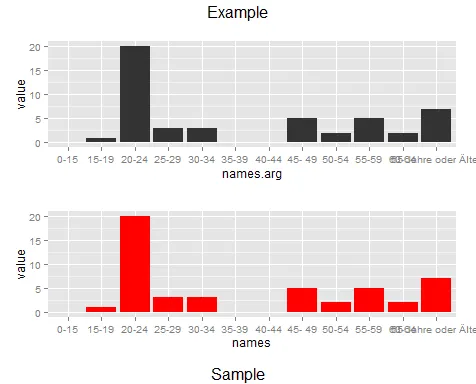
当你结合使用 top = 和 bottom = 参数时,它们可以正常工作:
grid.arrange(p1, p2, ncol=1, top = "Example", bottom = "Sample")
根据评论编辑
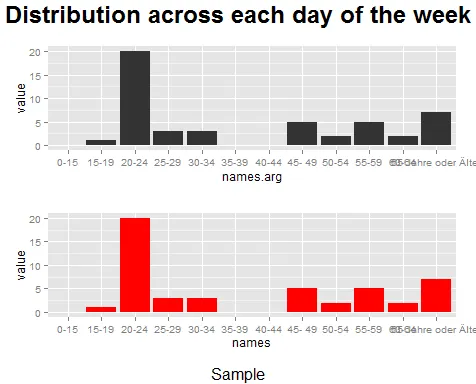
在 grid.arrange() 调用之外创建标题:
title <- textGrob("Distribution across each day of the week", gp = gpar(fontface = "bold", cex = 1.5))
并修改调用:
grid.arrange(p1, p2, ncol=1, top = title, bottom = "Sample")
library(grid),您的代码将正常工作 -textGrob是该软件包中的一个函数。例如,使用您的代码:`library(gridExtra); library(grid) ;grid.arrange(rectGrob(), top = textGrob("Distribution across each day of the week", gp = gpar(fontface = "bold", cex = 1.5)), bottom="Day of the week")` - user20650