一个想法是使用点云创建三角形网格,可能通过 Delanuay 三角剖分实现。
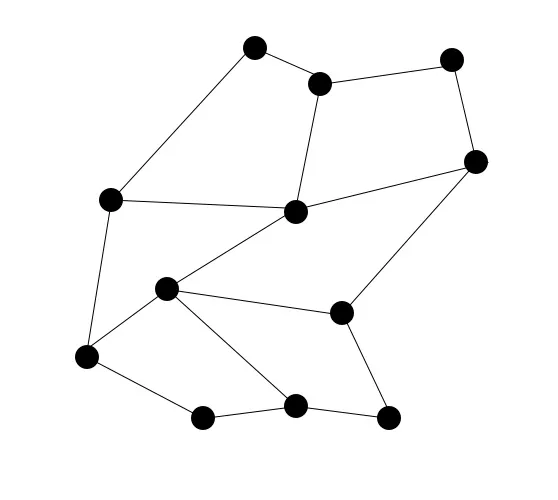
填充这些三角形的颜色,然后运行级别集或主动轮廓分割,找到其颜色不同于外部“背景”颜色的形状的外部边界。
https://xphilipp.developpez.com/contribuez/SnakeAnimation.gif
上面的动画没有完全展示,但许多类似的算法可以进行配置。
注意:三角剖分算法必须进行调整,以免仅创建凸包 - 例如从 Delaunay 结果中删除具有太大角度和边的三角形。初步代码可能如下:
from scipy.spatial import Delaunay

points = np.array([[13.43, 12.89], [14.44, 13.86], [13.67, 15.87], [13.39, 14.95],\
[12.66, 13.86], [10.93, 14.24], [11.69, 15.16], [13.06, 16.24], [11.29, 16.35],\
[10.28, 17.33], [10.12, 15.49], [9.03, 13.76], [10.12, 14.08], [9.07, 15.87], \
[9.6, 16.68], [7.18, 16.19], [7.62, 14.95], [8.39, 16.79], [8.59, 14.51], \
[8.1, 13.43], [6.57, 11.59], [7.66, 11.97], [6.94, 13.86], [6.53, 14.84], \
[5.48, 12.84], [6.57, 12.56], [5.6, 11.27], [6.29, 10.08], [7.46, 10.45], \
[7.78, 7.21], [7.34, 8.72], [6.53, 8.29], [5.85, 8.83], [5.56, 10.24], [5.32, 7.8], \
[5.08, 9.86], [6.01, 5.75], [6.41, 7.48], [8.19, 5.69], [8.23, 4.72], [6.85, 6.34], \
[7.02, 4.07], [9.4, 3.2], [9.31, 4.99], [7.86, 3.15], [10.73, 2.82], [10.32, 4.88], \
[9.72, 1.58], [11.85, 5.15], [12.46, 3.47], [12.18, 1.58], [11.49, 3.69], \
[13.1, 4.99], [13.63, 2.61]])

tri = Delaunay(points,furthest_site=False)
res = []
for t in tri.simplices:
  A,B,C = points[t[0]],points[t[1]],points[t[2]]
  e1 = B-A; e2 = C-A
  num = np.dot(e1, e2)
  n1 = np.linalg.norm(e1); n2 = np.linalg.norm(e2)
  denom =  n1 * n2
  d1 = np.rad2deg(np.arccos(num/denom))
  e1 = C-B; e2 = A-B
  num = np.dot(e1, e2)
  denom = np.linalg.norm(e1) * np.linalg.norm(e2)
  d2 = np.rad2deg(np.arccos(num/denom))
  d3 = 180-d1-d2
  res.append([n1,n2,d1,d2,d3])

res = np.array(res)
m = res[:,[0,1]].mean()*res[:,[0,1]].std()

mask = np.any(res[:,[2,3,4]] > 110) & (res[:,0] < m) & (res[:,1] < m )

plt.triplot(points[:,0], points[:,1], tri.simplices[mask])
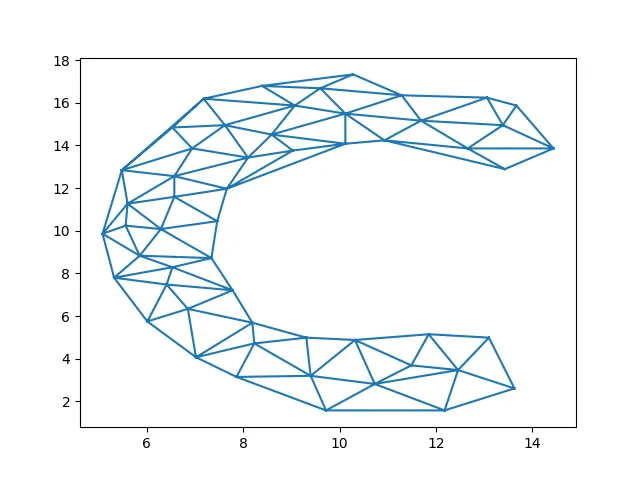
然后填充颜色并分段。

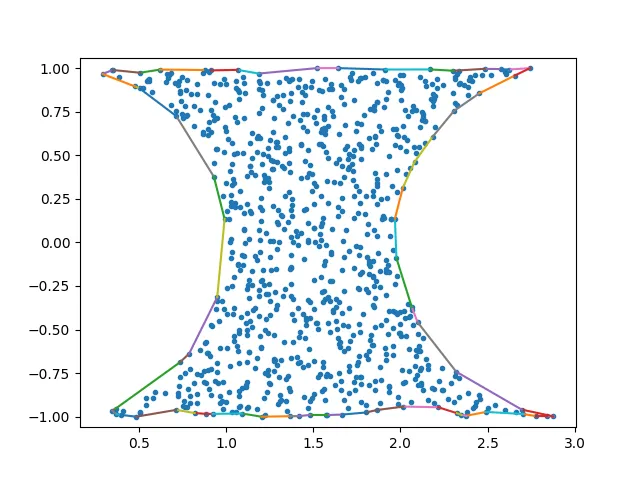
- 实际上这不是凸包。凸包应该没有凸性,即没有凹陷的部分。它只是外部的四个点。
- 我不明白你实际上想要什么。为什么只选择中间的那两个点?为什么不选择其他点?在你的实际用例中,这可能更有意义,但就连接这些点而言,在这个例子中你的选择似乎完全是任意的。为什么使用6个点而不像左边那样使用5个点?为什么不使用4个点,就像真正的凸包一样?
- alkasm