matplotlib.pyplot.hist的normed属性错误

7
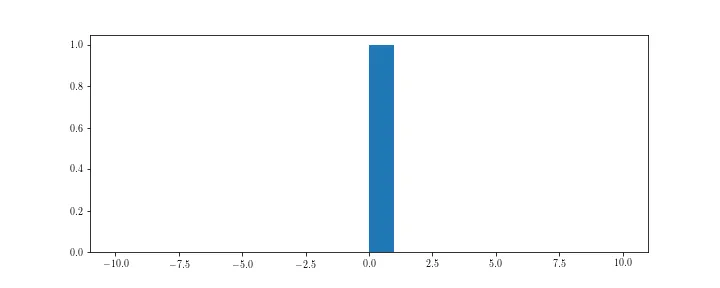
我正在创建一个以天为组织方式的数据框架的直方图。在某些天里,数据可能完全为空。因此,当我使用
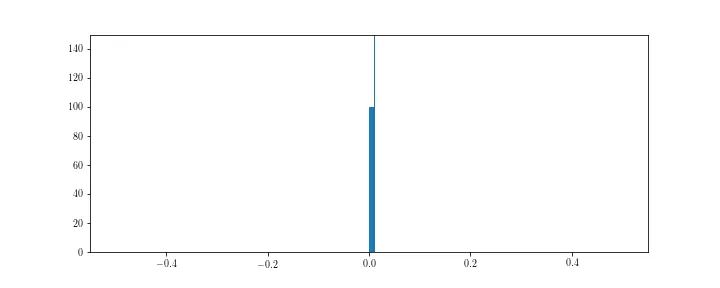
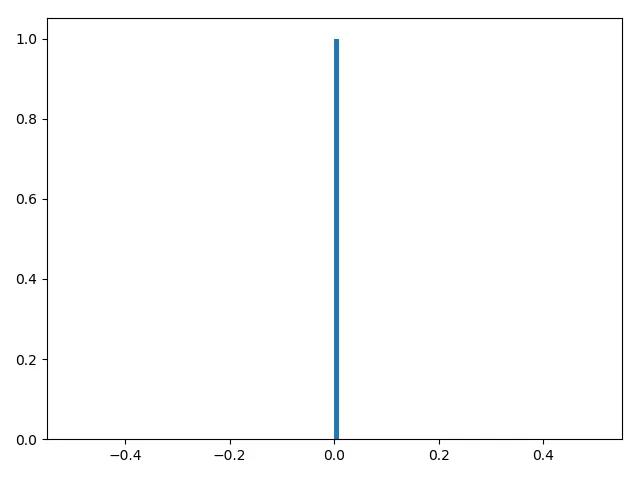
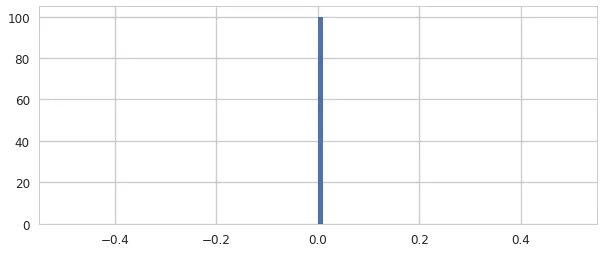
normed = True属性绘制直方图时,我希望看到一个居中于零并且高度等于1的单个bin。然而,我发现高度等于bin的数量。我该如何解决这个问题?我想用直方图表示概率密度函数,因此最大值应该为1。
代码示例和输出:
plt.rcParams['figure.figsize'] = 10, 4
data = np.zeros((1000))
l = plt.hist(data,normed = True, bins = 100)

在此输入图片描述

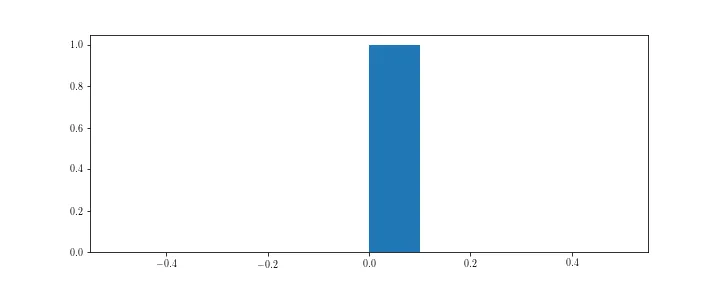
编辑: 我现在看到属性normed已被弃用。然而,如果我尝试使用属性density,我会得到错误消息AttributeError: Unknown property density


请返回翻译后的文本:具体来说,这个重复问题的答案(https://dev59.com/72865IYBdhLWcg3wU9CI#16399202) - DavidG
2个回答

6
你所看到的图形是正确的,因为曲线(直方图/柱状图)下的面积应为1。在你的图中确实如此。为了强调这一点,我在x=0.01处创建了一条垂直线,你会注意到条形的宽度确实为0.01。由于条形的高度为100,因此面积为100 * 0.01 = 1。
plt.rcParams['figure.figsize'] = 10, 4
data = np.zeros((1000))
l = plt.hist(data,normed = True, bins = 100)
plt.axvline(0.01, lw=1)
plt.ylim(0, 150)

如果使用density=True,结果将会相同。

l = plt.hist(data,density = True, bins = 100)

enter image description here

按照jdehesa的建议,以下是您的操作方式

l = plt.hist(data,density = True, bins=np.arange(-10, 11))

enter image description here

使用DavidG基于this答案的建议,可以得到高度为1,但是面积没有归一化为1。

weights = np.ones_like(data)/float(len(data))
l = plt.hist(data,weights=weights)

enter image description here

最后,如果你需要高度为1、宽度为1(因此面积等于1)并且规范化后的面积,你可以使用单个条形图箱。

l = plt.hist(data, density=True, bins=1)
plt.xlim(-10, 10)

enter image description here


5

如其他人所解释的那样,normed=True(或最近版本Matplotlib中的density=True)使直方图下面的区域等于1。您可以按照以下方式获取代表样本落在每个bin上的分数的直方图:

import matplotlib.pyplot as plt
import numpy as np

data = np.zeros((1000))
# Compute histogram
hist, bins = np.histogram(data, density=True, bins=100)
# Width of each bin
bins_w = np.diff(bins)
# Compute proportion of sample in each bin
hist_p = hist * bins_w
# Plot histogram
plt.bar(bins[:-1], hist_p, width=bins_w, align='edge')

结果:

占比的直方图

您也可以制作每个区间宽度为1的直方图,但这是一种更受限制的解决方案。

编辑:正如其他答案中指出的那样,这基本上相当于给plt.hist正确的weights参数。


网页内容由stack overflow 提供, 点击上面的
可以查看英文原文,
原文链接