测试数据:
set.seed(123)
Data <- data.frame(Pro=rnorm(20), Cla=rnorm(20), Neu=rnorm(20))
我希望能够将每个样本(行)绘制为六边形中的点(顶部图像)。点的位置基于三个坐标,它们之间有120度的角度(底部图像)。
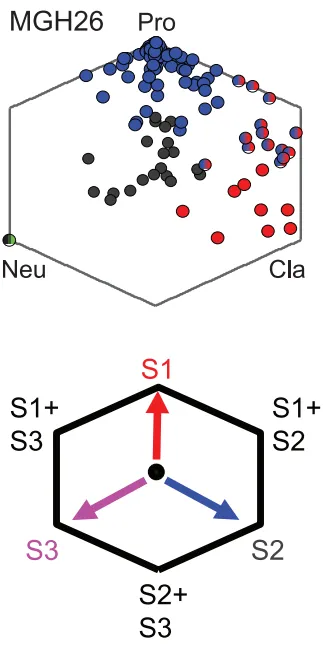
(来自 Anoop P. Patel 等人的《科学》杂志,2014年)
set.seed(123)
Data <- data.frame(Pro=rnorm(20), Cla=rnorm(20), Neu=rnorm(20))

library(tidyverse)
#> Loading tidyverse: ggplot2
#> Loading tidyverse: tibble
#> Loading tidyverse: tidyr
#> Loading tidyverse: readr
#> Loading tidyverse: purrr
#> Loading tidyverse: dplyr
#> Warning: package 'dplyr' was built under R version 3.4.2
#> Conflicts with tidy packages ----------------------------------------------
#> filter(): dplyr, stats
#> lag():    dplyr, stats
Data %>%
  # Separating the S1, S2 and S3 axes into their x-y components is done using simple trigonometry.
  # S1 is the trivial case as it only has y component.
  # S2 and S3 are both 30 degrees (pi/6 radians) below the x-axis
  mutate(S1_x = Pro*cos(pi/2), S1_y = Pro*sin(pi/2), # Deconvolve S1 axis into cartesian coordinates (x,y)
         S2_x = Cla*cos(pi/6), S2_y = -Cla*sin(pi/6), # Deconvolve S2 axis into cartesian coordinates (x,y)
         S3_x = -Neu*cos(pi/6), S3_y = -Neu*sin(pi/6)) %>%  # Deconvolve S3 axis into cartesian coordinates (x,y)
  mutate(x = S1_x + S2_x + S3_x, y = S1_y + S2_y + S3_y) %>% # Combine x and y compononts from S1, S2 and S3
  ggplot(aes(x = x, y=y))+geom_point()

# Just to prove that the maths works, plot the hexagon described by unit length
path <- data.frame(Pro = c(1,1,0,0,0,1,1), Cla = c(0,1,1,1,0,0,0), Neu = c(0,0,0,1,1,1,0))
path %>%
  mutate(S1_x = Pro*cos(pi/2), S1_y = Pro*sin(pi/2),
         S2_x = Cla*cos(pi/6), S2_y = -Cla*sin(pi/6),
         S3_x = -Neu*cos(pi/6), S3_y = -Neu*sin(pi/6)) %>%
  mutate(x = S1_x + S2_x + S3_x, y = S1_y + S2_y + S3_y) %>%
  ggplot(aes(x = x, y=y))+geom_path()

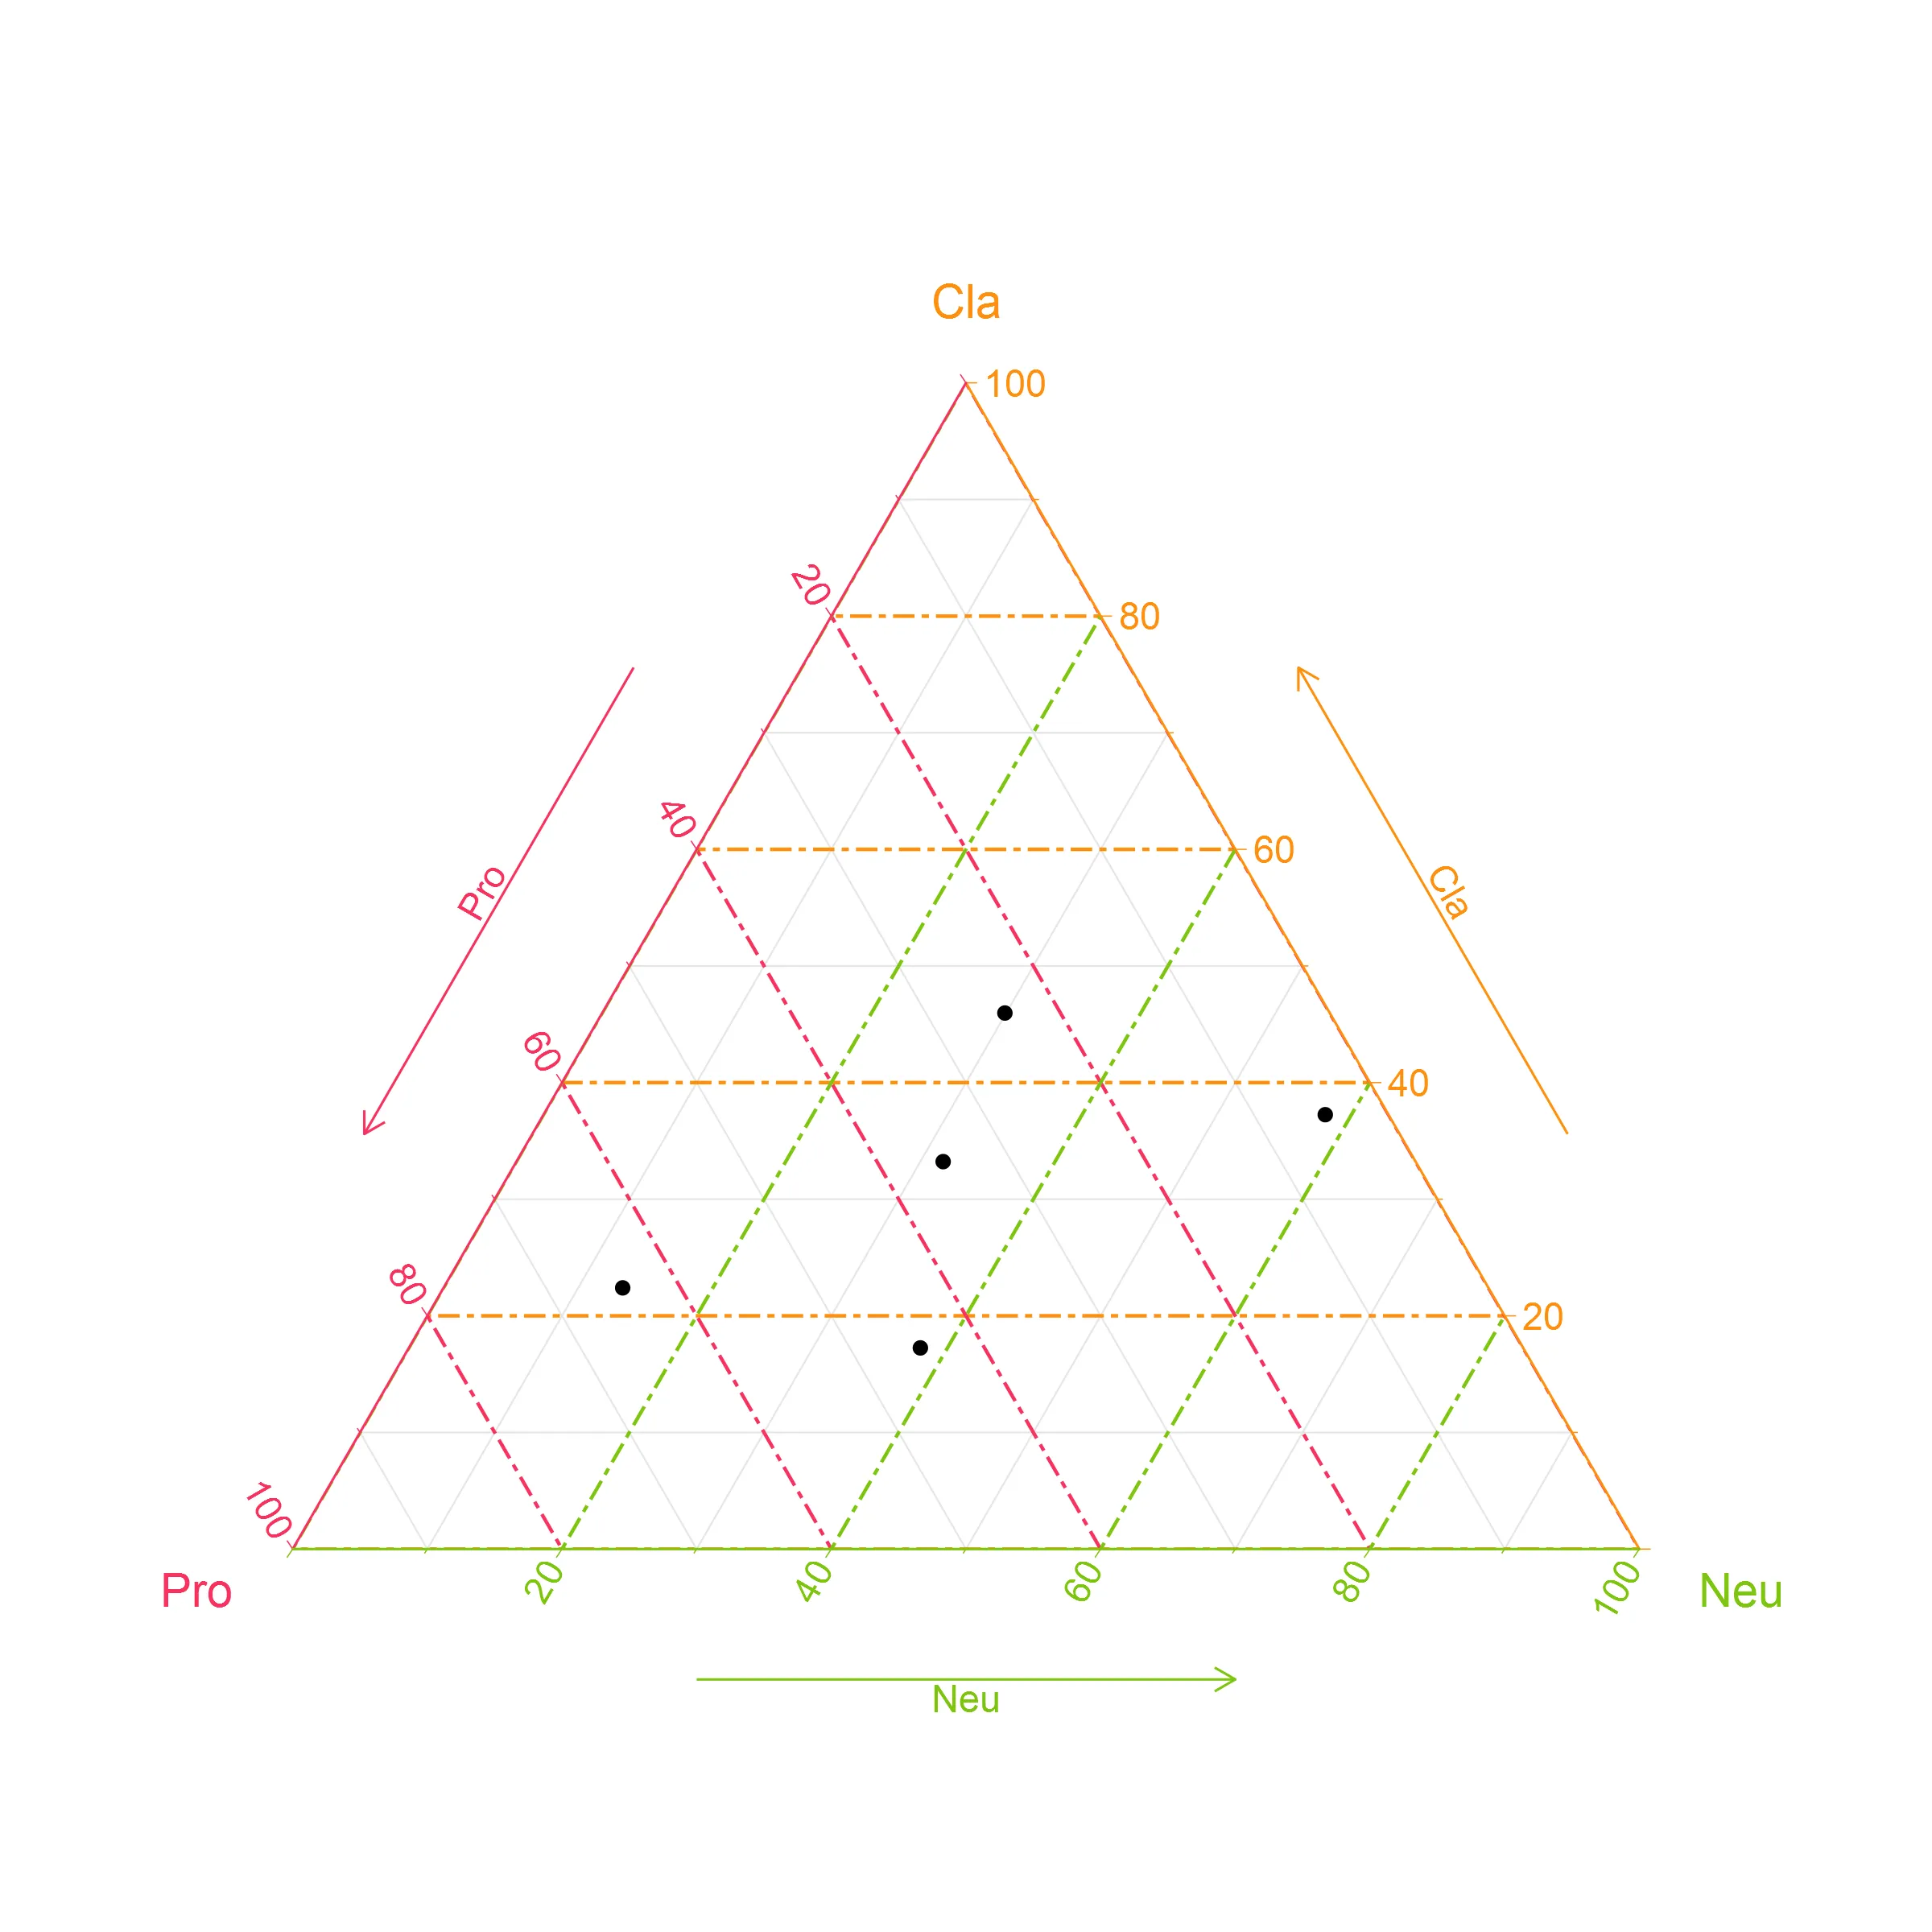
更标准的方法是使用三元图来实现你的目标。我理解如果六边形更适合你展示数据的方式,但是这个图更容易构建因为有一个ggplot包。
require(ggplot2)
require(ggtern)

ggtern(Data, aes(Pro, Cla,Neu))+
  geom_point()+
  theme_tropical(base_size=14)
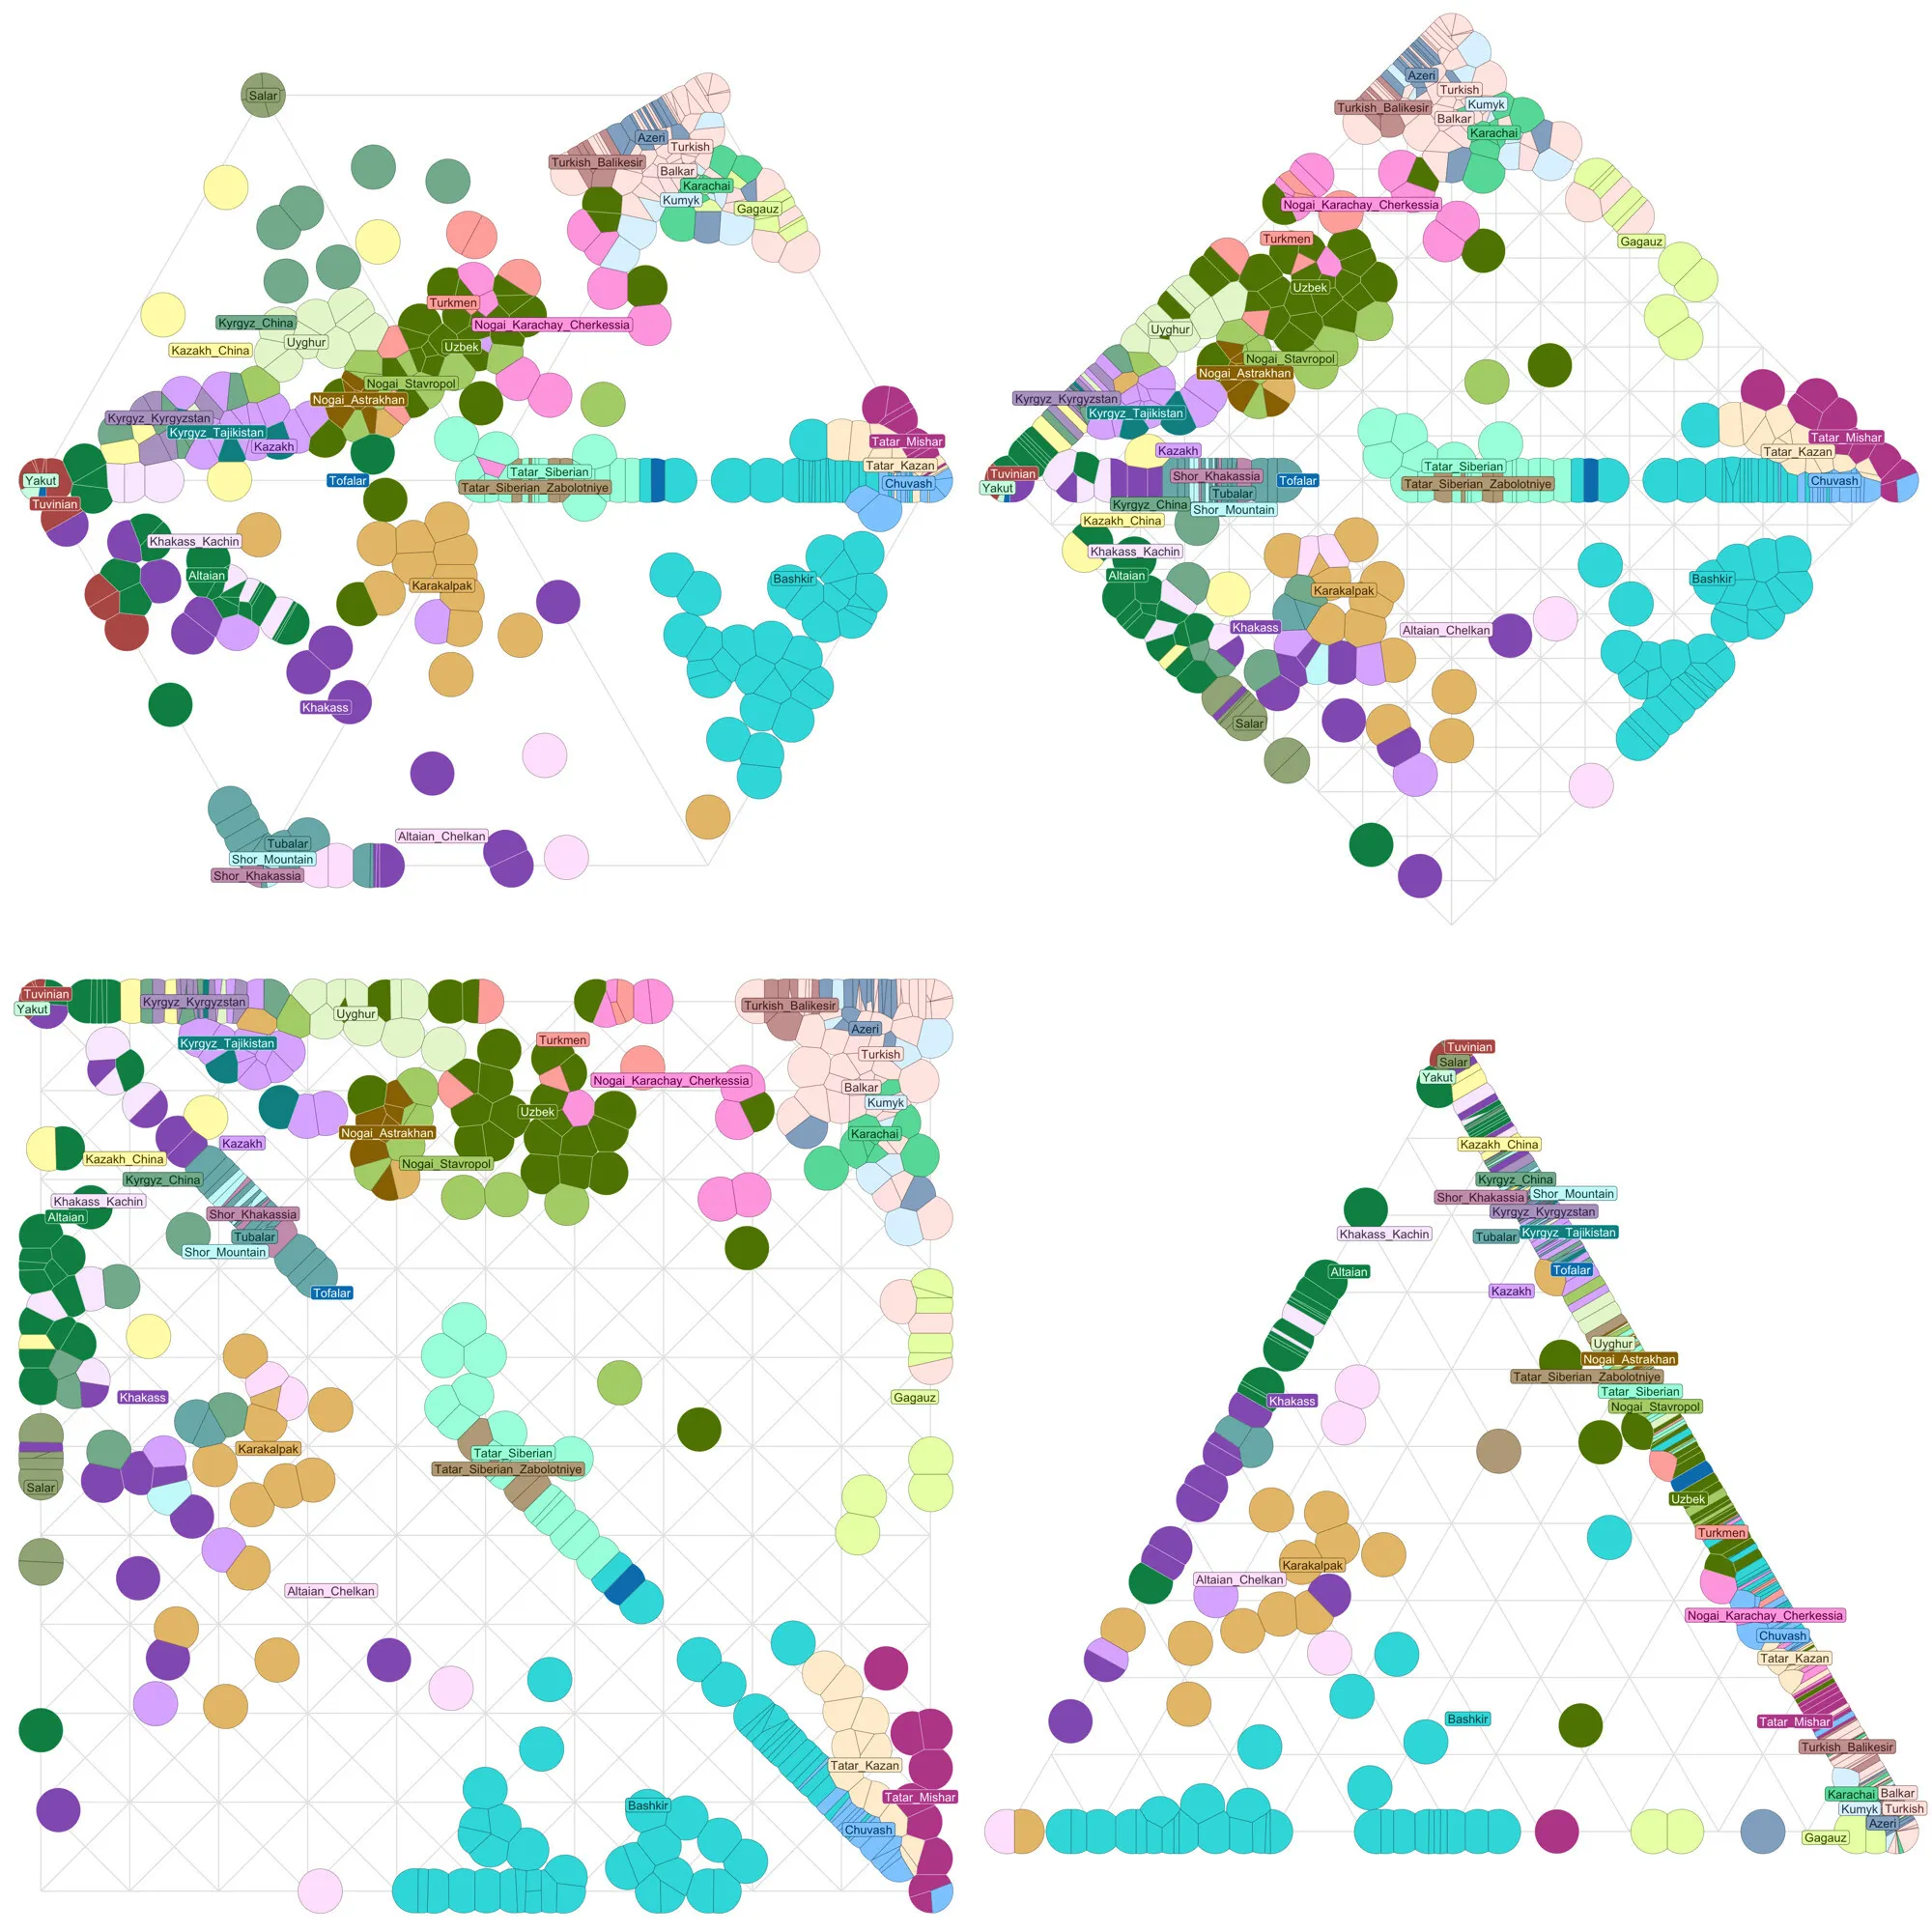
我需要创建一个三元图的六边形版本,我的数据有六列总和为1,并且我需要绘制样本,使在一列中值为1的样本绘制在六边形的一个角落。我最终修改了一个绘制三元图的脚本:
library(tidyverse)
library(ggforce)
library(ggrepel)

t=read.table("https://pastebin.com/raw/5BVbJ4E9",row.names=1) # hexagon
# t=read.table("https://pastebin.com/raw/XNV7Xmmj",row.names=1) # square
# t=read.table("https://pastebin.com/raw/QvdWWvwx",row.names=1) # triangle

corners=rbind(c(.5,sqrt(3)/2),c(1,0),c(.5,-sqrt(3)/2),c(-.5,-sqrt(3)/2),c(-1,0),c(-.5,sqrt(3)/2)) # hexagon
# corners=rbind(c(0,1),c(1,0),c(0,-1),c(-1,0)) # diamond
# corners=rbind(c(1,1),c(1,-1),c(-1,-1),c(-1,1)) # square
# corners=rbind(c(0,sqrt(3)/2),c(-1,-sqrt(3)/2),c(1,-sqrt(3)/2)) # triangle

xy=as.data.frame(as.matrix(t)%*%corners)

# for hexagon
grid=as.data.frame(rbind(cbind(corners,rbind(corners[-1,],corners[1,])),cbind(corners,matrix(rep(0,12),ncol=2))))

# for diamond or square plot
# grid=apply(rbind(c(1,2,4,3),c(1,4,2,3),c(1,2,1,4),c(3,2,3,4),c(4,1,4,3),c(2,1,2,3)),1,function(x)cbind(
#   seq(corners[x[1],1],corners[x[2],1],length.out=11),
#   seq(corners[x[1],2],corners[x[2],2],length.out=11),
#   seq(corners[x[3],1],corners[x[4],1],length.out=11),
#   seq(corners[x[3],2],corners[x[4],2],length.out=11)
# )%>%as.data.frame)%>%bind_rows

# for ternary plot (triangle)
# grid=apply(rbind(c(1,2,3,2),c(1,3,2,3),c(2,1,3,1)),1,function(x)cbind(
#   seq(corners[x[1],1],corners[x[2],1],length.out=11),
#   seq(corners[x[1],2],corners[x[2],2],length.out=11),
#   seq(corners[x[3],1],corners[x[4],1],length.out=11),
#   seq(corners[x[3],2],corners[x[4],2],length.out=11)
# )%>%as.data.frame)%>%bind_rows

pop=sub(":.*","",rownames(xy))
centers=aggregate(xy,by=list(pop),mean)
xy$pop=pop

set.seed(1234)
color=as.factor(sample(seq(1,length(unique(xy$pop)))))
col=rbind(c(60,80),c(25,95),c(30,70),c(70,50),c(60,100),c(20,50),c(15,40))
hues=max(ceiling(length(color)/nrow(col)),8)
pal1=as.vector(apply(col,1,function(x)hcl(seq(15,375,length=hues+1)[1:hues],x[1],x[2])))
pal2=as.vector(apply(col,1,function(x)hcl(seq(15,375,length=hues+1)[1:hues],ifelse(x[2]>50,.8*x[1],.2*x[1]),ifelse(x[2]>50,.3*x[2],100))))

# add a small random factor so geom_voronoi_tile won't fail because of too many overlapping points
xy$V1=xy$V1+runif(nrow(xy))/1e3
xy$V2=xy$V2+runif(nrow(xy))/1e3

ggplot(xy,aes(x=V1,y=V2,group=-1L))+
geom_segment(data=grid,aes(x=V1,y=V2,xend=V3,yend=V4),color="gray90",size=.3)+
geom_voronoi_tile(aes(fill=color[as.factor(pop)],color=color[as.factor(pop)]),size=.07,max.radius=.05)+
# geom_point(data=centers,aes(x=V1,y=V2,color=color,fill=color),shape=21,size=2)+
# geom_label(data=centers,aes(x=V1,y=V2,label=Group.1,color=color,fill=color),alpha=.7,size=2.2,label.r=unit(.07,"lines"),label.padding=unit(.07,"lines"),label.size=0)+
geom_label_repel(data=centers,aes(x=V1,y=V2,label=Group.1,color=color,fill=color),max.overlaps=Inf,point.size=0,size=2.2,label.r=unit(.1,"lines"),label.padding=unit(.1,"lines"),label.size=.1,box.padding=0)+
coord_fixed(xlim=c(-1.08,1.08),ylim=c(-1.08,1.08),expand=F)+
scale_fill_manual(values=pal1)+
scale_color_manual(values=pal2)+
theme(
  axis.text=element_blank(),
  axis.ticks=element_blank(),
  axis.title=element_blank(),
  legend.position="none",
  panel.background=element_rect(fill="white"),
  plot.margin=margin(0,0,0,0,"cm")
)

ggsave("a.png",width=7,height=7)
ggforce 用于使用 Voronoi tessellation 绘制点:https://ggforce.data-imaginist.com/reference/geom_delvor.html。当我尝试安装 ggforce 时,它一开始失败了,因为它的依赖项 units 无法安装。通过运行 install.packages("units"),我发现需要运行 brew install udunits(在 Debian 上是 libudunits2-dev,在 RPM 上是 udunits2-devel)。