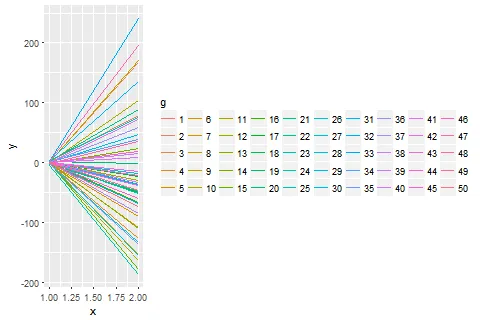
我有一些ggplot的功能,但我希望在用户滥用它时给予警告。问题在于:如果有许多组并且组名很长,图例会变得非常大,占据整个图:
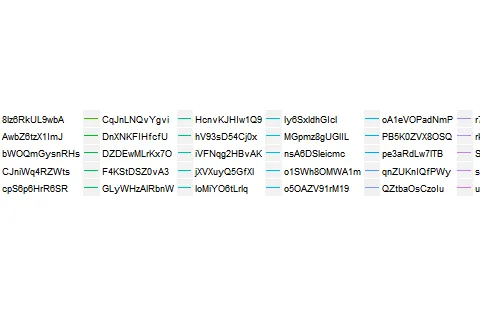
但如果我更改情节名称,我会得到:
- ggplot / ggbuild 对象
- 绘图窗口的尺寸(默认为 480 x 320),但可以更改。
我想利用这些来估算图例占用的总面积(以便在图例大小与绘图大小之比过大时发出警告)。以下是我用来创建图形的示例代码:
library(ggplot2)

# stolen from https://ryouready.wordpress.com/2008/12/18/generate-random-string-name/
MHmakeRandomString <- function(n=1, lenght=12) {
    randomString <- c(1:n)
    for (i in 1:n)
    {
        randomString[i] <- paste(sample(c(0:9, letters, LETTERS),
                                        lenght, replace=TRUE),
                                 collapse="")
    }
    return(randomString)
}

makeData <- function(k, useLongNames = FALSE) {

    x <- c(1, 100)
    X <- cbind(1, x)
    b <- matrix(rnorm(2*k), k, 2)

    y <- numeric(2*k)
    for (i in seq_len(k))
        y[1:2 + 2*(i-1)] <- X %*% b[i, ]

    df <- data.frame(x = c(1, n), y = y)

    if (useLongNames) {
        df$g <- factor(rep(MHmakeRandomString(k), each = 2))
    } else {
        df$g <- factor(rep(1:k, each = 2))
    }

    return(df)

}

# okayish plot
df <- makeData(50)
g0 <- ggplot(data = df, aes(x = x, y = y, group = g, color = g)) +
    geom_line() +
    guides(color=guide_legend(nrow=5))

# unreadable plot
df <- makeData(50, useLongNames = TRUE)
g1 <- ggplot(data = df, aes(x = x, y = y, group = g, color = g)) +
    geom_line() +
    guides(color=guide_legend(nrow=5))

# to plot
# x11(width = 480, height = 320)
# print(g0)
# x11(width = 480, height = 320)
# print(g1)
我认为答案在
ggplotGrob()中,但是我不熟悉grobs(也找不到清晰的文档),所以被卡住了。gGrob0 <- ggplotGrob(g0)
gGrob1 <- ggplotGrob(g1)
gGrob0$grobs[[15]]$grobs[[1]]$grobs # all legend elements
convertWidth(grobWidth(gGrob0$grobs[[15]]), unitTo = "inches") # 4.5128 inches
convertWidth(grobWidth(gGrob1$grobs[[15]]), unitTo = "inches") # 12.419 inches
# but this is not correct:
# number of legend columns x legend width <= plot width
# 10 * 12.419 <= 480
这似乎为我提供了很多关于我感兴趣的内容的信息。如何将这些信息转换为图例将占用的总宽度?非常感谢。
convertWidth)进行说明,首先,在指定窗口大小之前,您就已经“测量”了图例,其次,如果将绘图复制为位图,粘贴到例如paint.net中并使用“矩形选择”,则g0图例的大小为4.52“x 1.34”,而g1的大小为12.64“x 1.29”,因此grob宽度并不那么偏离。 对于我来说,整个图的大小是14.34“x 9.56”。Grob似乎是正确的方向,您只需要找到代表绘图本身的那个(我猜是3、6或7)。 - m-dzgGrob1$grobs[[15]]的宽度除以gGrob1$grobs[[7]]的宽度可以得到正确的结果。请随意将其发布为答案,以便我可以接受它。非常感谢! - Vandenman