编辑: 正如@TimH所指出的那样,可以通过
clf.decision_function(X)给出概率。下面的代码已经修正了这个问题。
predict_proba(X)的预测概率存在低概率的问题。根据官方文档
here的解释,问题在于:"...它将在非常小的数据集上产生无意义的结果"。
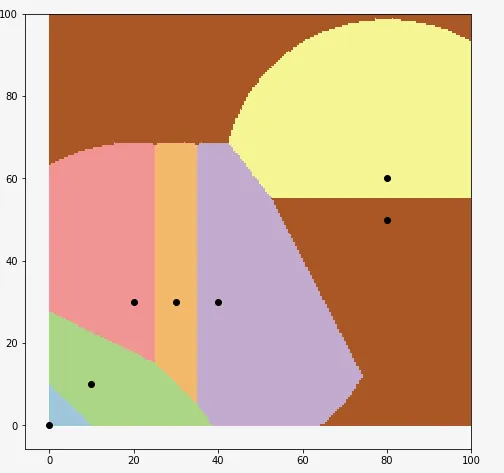
关键是理解SVM的结果概率。简而言之,在2D平面上你有7个类别和7个点。SVM试图找到一个线性分离器,以区分每个类别和其他每个类别(一对一的方法)。每次只选择两个类别。结果是归一化后的分类器投票结果。更详细的多类SVMs解释可以参考this(英文)或here (scikit-learn使用libsvm)。
稍加修改您的代码,我们可以看到确实选择了正确的类:
from sklearn import svm
import matplotlib.pyplot as plt
import numpy as np
X = [[0, 0], [10, 10],[20,30],[30,30],[40, 30], [80,60], [80,50]]
y = [0, 1, 2, 3, 3, 4, 4]
clf = svm.SVC()
clf.fit(X, y)
x_pred = [[10,10]]
p = np.array(clf.decision_function(x_pred))
prob = np.exp(p)/np.sum(np.exp(p),axis=1, keepdims=True)
classes = clf.predict(x_pred)
_ = [print('Sample={}, Prediction={},\n Votes={} \nP={}, '.format(idx,c,v, s)) for idx, (v,s,c) in enumerate(zip(p,prob,classes))]
相应的输出为:
Sample=0, Prediction=0,
Votes=[ 6.5         4.91666667  3.91666667  2.91666667  1.91666667  0.91666667 -0.08333333]
P=[ 0.75531071  0.15505748  0.05704246  0.02098475  0.00771986  0.00283998  0.00104477],
Sample=1, Prediction=1,
Votes=[ 4.91666667  6.5         3.91666667  2.91666667  1.91666667  0.91666667 -0.08333333]
P=[ 0.15505748  0.75531071  0.05704246  0.02098475  0.00771986  0.00283998  0.00104477],
Sample=2, Prediction=2,
Votes=[ 1.91666667  2.91666667  6.5         4.91666667  3.91666667  0.91666667 -0.08333333]
P=[ 0.00771986  0.02098475  0.75531071  0.15505748  0.05704246  0.00283998  0.00104477],
Sample=3, Prediction=3,
Votes=[ 1.91666667  2.91666667  4.91666667  6.5         3.91666667  0.91666667 -0.08333333]
P=[ 0.00771986  0.02098475  0.15505748  0.75531071  0.05704246  0.00283998  0.00104477],
Sample=4, Prediction=4,
Votes=[ 1.91666667  2.91666667  3.91666667  4.91666667  6.5         0.91666667 -0.08333333]
P=[ 0.00771986  0.02098475  0.05704246  0.15505748  0.75531071  0.00283998  0.00104477],
Sample=5, Prediction=5,
Votes=[ 3.91666667  2.91666667  1.91666667  0.91666667 -0.08333333  6.5  4.91666667]
P=[ 0.05704246  0.02098475  0.00771986  0.00283998  0.00104477  0.75531071  0.15505748],
Sample=6, Prediction=6,
Votes=[ 3.91666667  2.91666667  1.91666667  0.91666667 -0.08333333  4.91666667  6.5       ]
P=[ 0.05704246  0.02098475  0.00771986  0.00283998  0.00104477  0.15505748  0.75531071],
您可以看到决策区域:
X = np.array(X)
y = np.array(y)
fig = plt.figure(figsize=(8,8))
ax = fig.add_subplot(111)

XX, YY = np.mgrid[0:100:200j, 0:100:200j]
Z = clf.predict(np.c_[XX.ravel(), YY.ravel()])

Z = Z.reshape(XX.shape)
plt.figure(1, figsize=(4, 3))
plt.pcolormesh(XX, YY, Z, cmap=plt.cm.Paired)

for idx in range(7):
    ax.scatter(X[idx,0],X[idx,1], color='k')