Networkx: 如何从CSV文件创建图的边?

5

我正在尝试使用networkx创建图表,目前我已经从以下文本文件创建了节点: 文件1(user_id.txt)示例数据:

user_000001
user_000002
user_000003
user_000004
user_000005
user_000006
user_000007

文件2(user_country.txt)的示例数据:如果用户没有输入国家详细信息,则包含一些空白行。

 Japan
 Peru
 United States

 Bulgaria
 Russian Federation
 United States

文件 3(user_agegroup.txt)数据:包含四个年龄组

 [12-18],[19-25],[26-32],[33-39]

我有另外两个文件,包含用于在图中添加边的示例数据

文件4(id,agegroup.txt)

user_000001,[19-25]
user_000002,[19-25]
user_000003,[33-39]
user_000004,[19-25]
user_000005,[19-25]
user_000006,[19-25]
user_000007,[26-32]

文件5(id,country.txt)
(user_000001,Japan)
(user_000002,Peru)
(user_000003,United States)
(user_000004,)
(user_000005,Bulgaria)
(user_000006,Russian Federation)
(user_000007,United States)

迄今为止,我已经编写了以下代码来绘制仅包含节点的图表:(请检查代码,因为print g.number_of_nodes()从未打印正确的节点数,尽管print g.nodes()显示正确的节点数。)

import csv
import networkx as nx
import matplotlib.pyplot as plt
g=nx.Graph()

#extract and add AGE_GROUP nodes in graph
f1 = csv.reader(open("user_agegroup.txt","rb"))
for row in f1: 
    g.add_nodes_from(row)
    nx.draw_circular(g,node_color='blue')

#extract and add COUNTRY nodes in graph
f2 = csv.reader(open('user_country.txt','rb'))
for row in f2:
    g.add_nodes_from(row) 
    nx.draw_circular(g,node_color='red')

#extract and add USER_ID nodes in graph
f3 = csv.reader(open('user_id.txt','rb'))
for row in f3:
    g.add_nodes_from(row)
    nx.draw_random(g,node_color='yellow')

print g.nodes()
plt.savefig("path.png")
print g.number_of_nodes()
plt.show()

除此之外,我无法想象如何从file4和file5添加边缘。 如果有代码的帮助,将不胜感激。 谢谢。
所以,针对您提供的示例,您期望获得18个节点? - Abdallah Sobehy
1
关于添加边,您可以先读取行,然后使用 G.add_edge(row[0], row[1])。 - Abdallah Sobehy
1
g.number_of_nodes 只返回 g.node(内部是一个字典)的长度,而 g.nodes() 也只是返回 g.node。因此,除非在检查 len(g.nodes())g.number_of_nodes) 之间修改了图形,否则很难看出这两个函数有什么不同。这三个文件中的所有条目都是唯一的吗?任何重复的条目将对应于相同的节点。(字典文档 - Bonlenfum
@Bonlenfum 在文件1、2和3中,文件2肯定有重复项,因为我在我的问题中提供了示例数据。尽管如此,你的观点是正确的。然而,@Abdallah的解决方案对于g,number_of_nodesg.number_of_edges也产生了正确的结果。 - VivekP20
公正的观点,我应该注意到了重复的国家。你对奇怪的国家名称的问题可能只是与特殊字符有关。例如,请参见https://dev59.com/xnRB5IYBdhLWcg3w26t3#844443以了解如何读取utf8。无论如何,提供的解决方案很好。 - Bonlenfum
显示剩余2条评论
2个回答

3
为了简化,我在 user_id.txt 和 id,country.txt 文件中使用了用户ID [1、2、3、4、5、6、7]。你的代码存在一些问题:
1- 首先,你添加一些节点到图中(例如来自 user_id.txt 文件),然后你绘制它,然后你从另一个文件中添加一些其他节点到图中,然后你再次在同一个图上重新绘制整个图。因此,最终你会得到许多图在一个图中。
2- 你两次使用了 draw_circular 方法进行绘制,这就是为什么蓝色节点从未出现,因为它们被“红色”节点覆盖了。
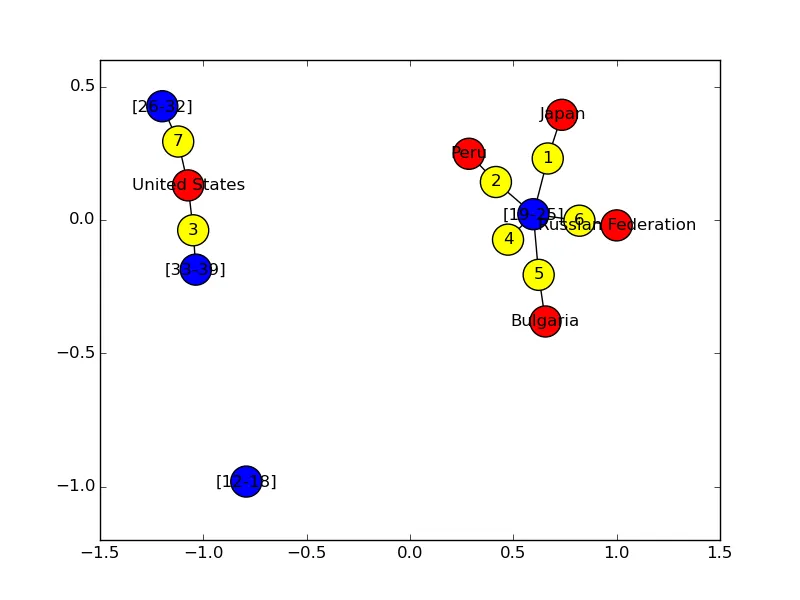
我对你的代码做了一些更改,最终只绘制一次。为了以所需的颜色绘制节点,我在添加节点时添加了一个名为 colors 的属性。然后我使用此属性构建了一个颜色映射,将其发送到 draw_networkx 函数。 最后,由于 id,country.txt 中存在空字段,添加边缘有点棘手,因此在创建图之前必须删除空节点。以下是代码和随后出现的图像。
G=nx.Graph()

#extract and add AGE_GROUP nodes in graph
f1 = csv.reader(open("user_agegroup.txt","rb"))
for row in f1: 
    G.add_nodes_from(row, color = 'blue')

#extract and add COUNTRY nodes in graph
f2 = csv.reader(open('user_country.txt','rb'))
for row in f2:
    G.add_nodes_from(row, color = 'red') 

#extract and add USER_ID nodes in graph
f3 = csv.reader(open('user_id.txt','rb'))
for row in f3:
    G.add_nodes_from(row, color = 'yellow')

f4 = csv.reader(open('id,agegroup.txt','rb'))
for row in f4:
    if len(row) == 2 : # add an edge only if both values are provided
        G.add_edge(row[0],row[1])

f5 = csv.reader(open('id,country.txt','rb'))

for row in f5:
    if len(row) == 2 : # add an edge only if both values are provided
        G.add_edge(row[0],row[1])
# Remove empty nodes
for n in G.nodes():
    if n == '':
        G.remove_node(n)
# color nodes according to their color attribute
color_map = []
for n in G.nodes():
    color_map.append(G.node[n]['color'])
nx.draw_networkx(G, node_color = color_map, with_labels = True, node_size = 500)

plt.savefig("path.png")

plt.show()

enter image description here


非常感谢@Abdallah Sobehy。这非常有帮助。通过调整这段代码,我现在能够将从文件中读取的边添加到图形中。但是我认为在第color_map.append(G.node[n]['color'])行中有一个小的语法错误,这就是为什么控制不会超过那个for循环,因此没有图形输出。 print g.nodesprint g.edges打印出正确的节点和边缘列表,这意味着代码在该错误行之前是正确的。您能否确认您的代码中没有任何错误,以便我可以继续接受您的答案? - VivekP20
draw_networkx 也不起作用。我将其更改为 draw_random,它可以工作。同样,draw_circular 也可以工作。 - VivekP20
nx.draw_networkx(G, node_color=color_map, with_labels=True, node_size=500) 也不起作用。我将其更改为 nx.draw_random(g),它有效了。同样,nx.draw_circular(g) 也可以工作。但是它仅绘制默认的红色节点而没有标签... 我猜测 node_color=color_map,with_labels=True 存在问题。如果您能解决这些问题,请编辑您的回答。 - VivekP20
在我回答之前,我运行了代码,一切正常。现在我无法验证,因为我现在没有我的机器。无论如何,只是一个小检查,我将图形命名为 G 而不是 g。请检查您是否正确使用了图形名称,并让我知道。 - Abdallah Sobehy
1
是的,我在我的代码中处理了G。我认为我已经解决了这个问题。我深入研究了我运行代码的整个数据集,并发现了一些“奇怪”的国家名称。此外,有几行数据也被搞乱了。我删除了它们。这解决了图中节点标签未显示的问题。但我仍然不知道为什么在nx.draw_networkx中添加with_labels = true参数时会抛出错误。当我删除此参数并再次运行代码时,令人惊讶的是它仍然可以工作,并且标签也显示出来了。啊,我就让它保持这样吧。 - VivekP20
有点奇怪,但如果它目前能够正常工作,你可以继续使用它。如果发生了什么事情,你可以在这里留下评论或提出另一个问题。 - Abdallah Sobehy

0

你可以使用类似于for的语句:

for a,b in df_edges.iterrows():
    G.add_edges_from([(b['source'], b['target'])])

网页内容由stack overflow 提供, 点击上面的
可以查看英文原文,
原文链接