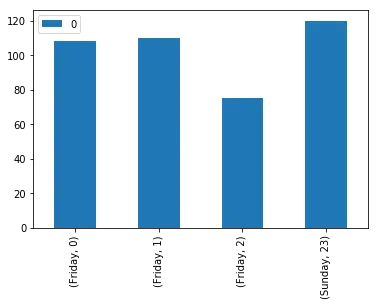
我有一个字典,其中元组是键,如下所示:
{('Friday', 0): 108, ('Friday', 1): 110, ('Friday', 2): 75, ... ('Sunday', 23): 120}
我正在尝试构建一个条形图,其中字典键在x轴上,字典值在y轴上:
trace0 = go.Bar(
    x=pump_dry_day_beh_dic.keys(),
    y=pump_dry_day_beh_dic.values(),
    name ='yyy'

)

fig = tools.make_subplots(rows=1, cols=1, specs=[[{}]],
                          shared_xaxes=True, shared_yaxes=True,
                          vertical_spacing=0.001)

fig.append_trace(trace0, 1, 1)
fig.append_trace(trace1, 1, 1)

fig['layout'].update(height=600, width=1000,  title='xxx')
fig['layout']['xaxis1'].update(title='day-hour')
fig['layout']['yaxis1'].update(title='Values')
plotly.offline.iplot(fig, filename=' xxx')
但是我遇到了以下错误:
 The 'x' property is an array that may be specified as a tuple,
    list, numpy array, or pandas Series
另一方面,如果我将上述代码更改为下面的代码,则会得到一个空白图。
   x=list(pump_dry_day_beh_dic.keys()),
    y=list(pump_dry_day_beh_dic.values()),
    name ='yyyy'
有没有办法解决这个问题?
谢谢。