对于每个
type的值,您需要构建一个自定义面板函数。幸运的是,如果您的函数紧密模仿现有的
lattice代码(首先查看
panel.xyplot),那么这不应该太难。例如,下面的两个自定义面板函数包含许多行代码,但只有几行(用注释标记)是我必须编写的。
一旦您定义了面板函数(从以下图表后面的代码块中复制它们),就可以像这样使用它们:
library(lattice)
library(latticeExtra)
library(gridExtra)
set.seed(100)
data <- data.frame(time=1:24,value=rnorm(24))
a <- xyplot(value~time, data, panel=panel.filled_S)
b <- xyplot(value~time, data, panel=panel.filled_smooth)
grid.arrange(a, b, ncol = 2)
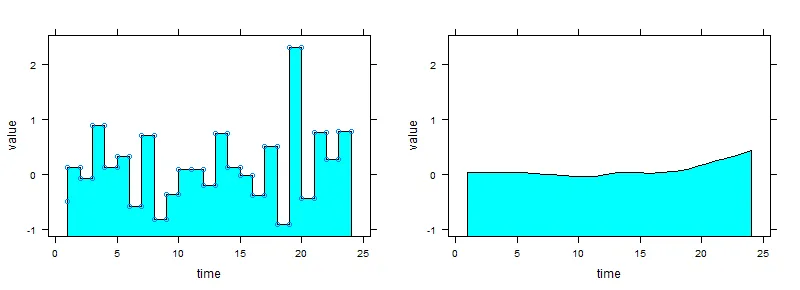
对于填充版本的type="S":
panel.filled_S <-
function(x,y, ...) {
horizontal <- FALSE
ord <- if (horizontal)
sort.list(y)
else sort.list(x)
n <- length(x)
xx <- numeric(2 * n - 1)
yy <- numeric(2 * n - 1)
xx[2 * 1:n - 1] <- x[ord]
yy[2 * 1:n - 1] <- y[ord]
xx[2 * 1:(n - 1)] <- x[ord][-n]
yy[2 * 1:(n - 1)] <- y[ord][-1]
panel.xyarea(x = xx, y = yy, ...)
panel.lines(x = xx, y = yy, ...)
}
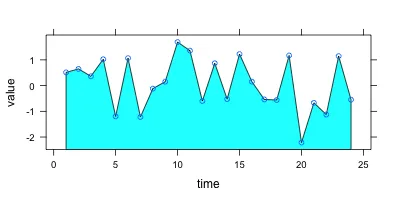
xyplot(value~time, data, panel=panel.filled_S, type="o")
对于type="smooth"的填充版本:
panel.filled_smooth <-
function (x, y, span = 2/3, degree = 1, family = c("symmetric",
"gaussian"), evaluation = 50, lwd = plot.line$lwd, lty = plot.line$lty,
col, col.line = plot.line$col, type, horizontal = FALSE,
..., identifier = "loess")
{
x <- as.numeric(x)
y <- as.numeric(y)
ok <- is.finite(x) & is.finite(y)
if (sum(ok) < 1)
return()
if (!missing(col)) {
if (missing(col.line))
col.line <- col
}
plot.line <- trellis.par.get("plot.line")
if (horizontal) {
smooth <- loess.smooth(y[ok], x[ok], span = span, family = family,
degree = degree, evaluation = evaluation)
panel.lines(x = smooth$y, y = smooth$x, col = col.line,
lty = lty, lwd = lwd, ..., identifier = identifier)
panel.xyarea(smooth$y, smooth$x, ...)
}
else {
smooth <- loess.smooth(x[ok], y[ok], span = span, family = family,
degree = degree, evaluation = evaluation)
panel.lines(x = smooth$x, y = smooth$y, col = col.line,
lty = lty, lwd = lwd, ..., identifier = identifier)
panel.xyarea(smooth$x, smooth$y, ...)
}
smooth
}

type=值的不完全通用(但简单)解决方案感兴趣? - Josh O'Brientype="S"和type="smooth"分别提供几个快速示例。 - Josh O'Brien