如何将多张图片(子图)合并成一张图片

3
我有两张图片想要保存为一个图中的子图。
我的当前代码可以将它们显示为子图。
import cv2 as cv
from matplotlib import pyplot as plt
image1 = cv.imread('someimage')
image2 = cv.imread('anotherimage')
plt.subplot(1, 2, 1), plt.imshow(image1, 'gray')
plt.subplot(1, 2, 1), plt.imshow(image2, 'gray')
plt.show()

OpenCV的imwrite无法直接使用,因为它需要一个图像作为输入。我想把这些子图保存在一张图片中,以便以后进行可视化分析。我该如何实现呢?

可以并排或上下放置。只是一个示例 :)

Two images in one

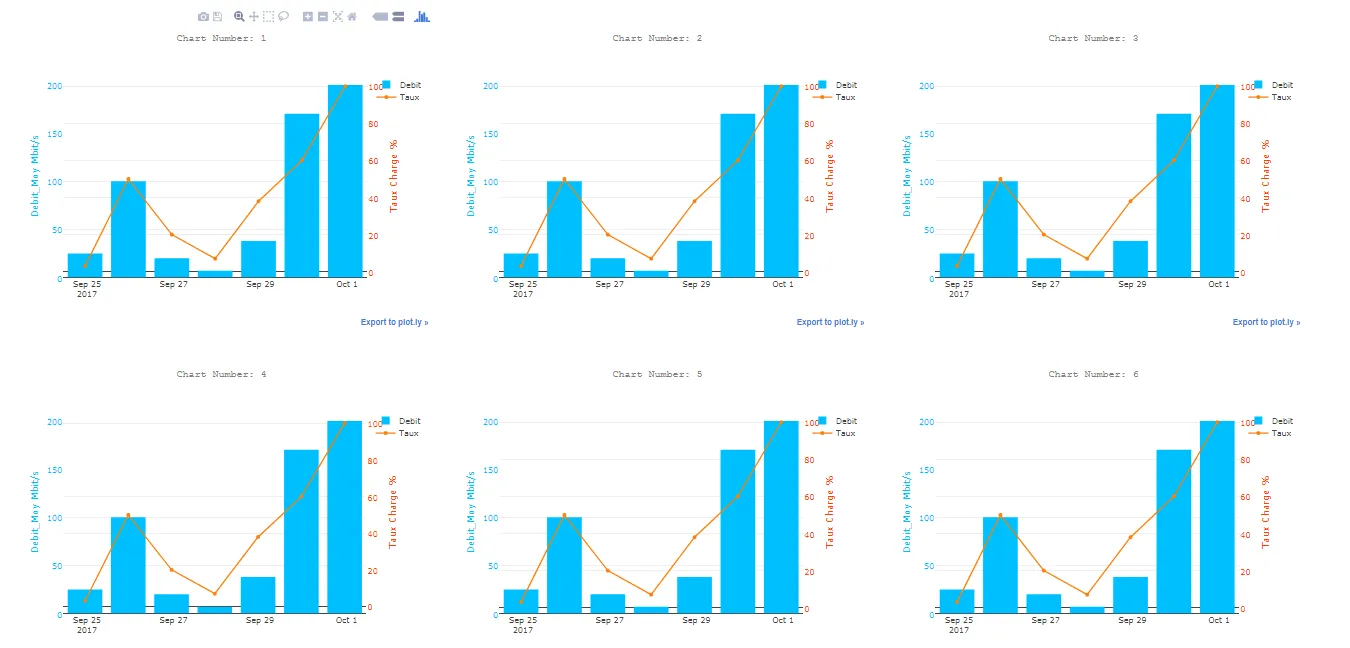
这个示例仅用于演示目的。我应该能够将多个图像保存到一个图像中,就像创建subplot(x,y)一样。例如,

enter image description here

4个回答

7

为其他读者补充说明:可以直接使用matplotlib.pyplot.savefig保存子图,其保存方式与plt.show()所显示的完全一致。

https://matplotlib.org/api/pyplot_api.html#matplotlib.pyplot.savefig

对于两幅图像,我想其他两个答案也可以用。

最终代码应该是这样的:

import cv2 as cv
from matplotlib import pyplot as plt
image1 = cv.imread('someimage')
image2 = cv.imread('anotherimage')
plt.subplot(1, 2, 1), plt.imshow(image1, 'gray')
plt.subplot(1, 2, 2), plt.imshow(image2, 'gray')
plt.savefig('final_image_name.extension') # To save figure
plt.show() # To show figure

3
import cv2 as cv
from matplotlib import pyplot as plt
image1 = cv.imread('someimage')
image2 = cv.imread('anotherimage') 
final_frame = cv.hconcat((image1, image2)) # or vconcat for vertical concatenation
cv.imwrite("image.png", final_frame)

能否将此适应多个图像?有时我有两个以上的图像,我想将它们保存到一个图像中。所以需要一种通用的解决方案。 - utengr
我想只要它们具有相同的维度,你就可以将连接放入迭代循环中。 - RMS
1
找到了解决方案,我可以使用savefig。 - utengr
@utengr 你能详细说明一下吗?我也在寻找一个简单的解决方案。 - Moondra

1
您可以使用 numpy.concatenate 来实现此目的:
import numpy as np
import cv2
image1 = cv.imread('someimage')
image2 = cv.imread('anotherimage')
final = np.concatenate((image1, image2), axis = 0)
cv2.imwrite('final.png', final)

axis = 0 将图像垂直拼接

axis = 1 将图像水平拼接


1
这个能否适用于多张图片?有时我需要保存超过两张图片到一张图片中,所以需要一个通用的解决方案。 - utengr

0

基于add_subplot的另一种解决方案。

我更喜欢使用add_subplot,因为它能够创建复杂的图表

import matplotlib.pyplot as plt

import numpy as np

ls_image_pt=['path1.jpg','path2.jpg']
for idx, dpath in enumerate(ls_image_pt):
    sub1 = fig.add_subplot(2, 2, idx + 1)
    image2 = cv.imread('dframe_0.png')
    sub1.imshow(image2, 'gray')


plt.setp(plt.gcf().get_axes(), xticks=[], yticks=[])
plt.tight_layout()
plt.show()

网页内容由stack overflow 提供, 点击上面的
可以查看英文原文,
原文链接