在ggplot2中固定图形大小

5

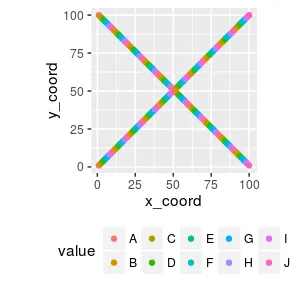
我在R中使用ggplot2包时遇到了一些问题。我有很多具有类似结构的数据,并想要绘制它们。因此,我想我可以编写一个函数并在循环中使用它。问题是不同的布局。在下面的示例中,有包含坐标(x和y)和值的df1。

df1 <- data.frame(x_coord = c(1:100,1:100), y_coord = c(100:1, 1:100),
                  value = LETTERS[1:10])
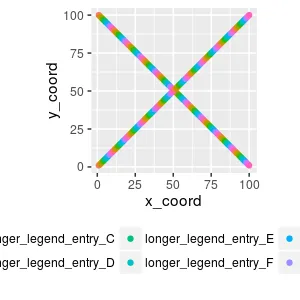
Df2几乎相同,但具有更长的值名称:

df2 <- data.frame(x_coord = c(1:100,1:100), y_coord = c(100:1, 1:100),
                  value = paste0("longer_legend_entry_" ,LETTERS[1:10] ) )

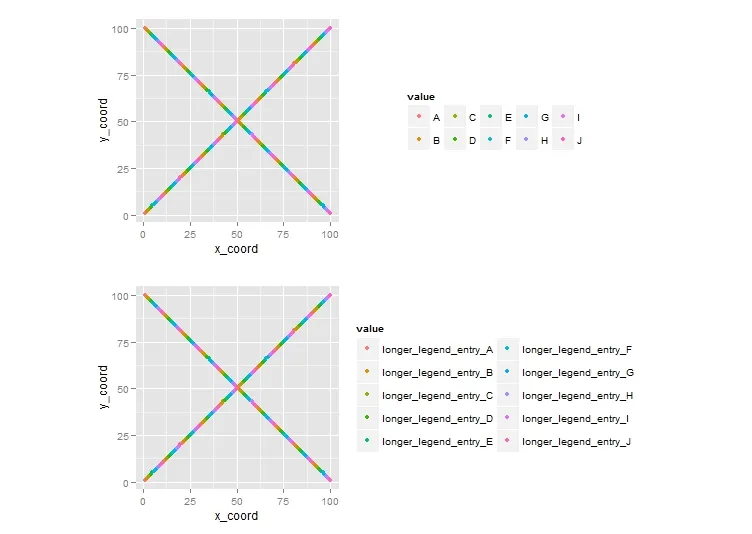
我的目标是使用 ggplot 来绘制 df1 和 df2 的图表,并使其大小相同。因此,我使用了 coord_fixed() 来保持它们的比例。但是,由于我需要在将图表保存为 PNG 格式时向 ggsave() 指定英寸大小,所以图例的不同大小会引起问题。

ggplot(data = df1, aes( x = x_coord, y = y_coord, color = value ) ) +
  geom_point() +
  theme( legend.position="bottom" ) +
  coord_fixed()

ggsave("plot1.png", width=3, height=3, dpi=100)

ggplot(data = df2, aes( x = x_coord, y = y_coord, color = value ) ) +
  geom_point() +
  theme( legend.position="bottom" ) +
  coord_fixed()

ggsave("plot2.png", width=3, height=3, dpi=100)

图1

图2

每个PNG图片的大小应该相同,即使图例不同。

非常感谢!


请查看http://www.cookbook-r.com/Graphs/Legends_(ggplot2)/,特别是修改图例标题和标签外观的部分。 - infominer
@infominer 感谢您的建议,但我需要一个专注于图形大小的解决方案,比如“将图形设置为2x2,并尽可能使用空间来显示图例”。也许有一种方法,比如保存具有固定宽度但灵活高度的PNG文件之类的。 - Chitou
https://dev59.com/TlwY5IYBdhLWcg3weXvV#32583612 - baptiste
1个回答

2

将图例放在右侧,为每个图例项提供行数,然后按照需要垂直排列图表会更容易。

library(gridExtra)
g1 = ggplot(data = df1, aes(x = x_coord, y = y_coord, color = value)) +
  geom_point() +
  theme(legend.position="right") +
  coord_fixed() + guides(col = guide_legend(nrow = 2))

g2 = ggplot(data = df2, aes( x = x_coord, y = y_coord, color = value ) ) +
  geom_point() +
  theme( legend.position="right" ) +
  coord_fixed() + guides(col = guide_legend(nrow = 5))

gA = ggplotGrob(g1)
gB = ggplotGrob(g2)
gA$widths <- gB$widths
grid.arrange(gA, gB)

在此输入图片描述

编辑:如果您仍希望将图例放在底部,请改用以下内容(但我认为正确的图例格式更具视觉吸引力)。

gA = ggplotGrob(g1)
gB = ggplotGrob(g2)
gB$heights <- gA$heights
grid.arrange(gA, gB)

网页内容由stack overflow 提供, 点击上面的
可以查看英文原文,
原文链接