修改ggplot2中的字体

68

我正在寻找一种修改ggplot中字体类型的方法。目前,我只想将字体更改为“courier”字体系列就已经足够了,但最终我的目标是调用自定义字体模板——任何有关后者的输入都将不胜感激。

我做了一些功课,查看了以下帖子和文章:

可能是因为我还是一个对ggplot2一窍不通的业余爱好者,但我甚至没有能够将图表字体切换到courier。有什么帮助吗?我已经包含了下面的图表数据和代码,所以希望这都足够容易跟随。


tikzDevice 和 XeTeX 怎么样? - baptiste
7个回答

34

我认为你的回答可以,但你可以更简单地表达:

install.packages("extrafont");library(extrafont)
font_import("Trebuchet MS")
library(ggplot2)
qplot(1:10)+theme(text=element_text(family="Trebuchet MS"))

据我所知,对于“annotate()”,您需要提供字体信息,例如“family=myfamily,fontface=myfontface”,其中“myfamily”和“myfontface”应与根据您的方法传递给“theme()”的内容一致。如果您有多个“annotate()”调用,则有点麻烦。我没有检查过,但我认为上面的答案也没有处理“annotate()”。 - PatrickT

31

我相对轻松地解决了我的查询问题,这是一个分为两步的解决方案,如果不遵循回答成员的建议,我可能不会得出这个方案。

要更改ggplot文本默认设置,我修改了Brandon提供给我的代码,代码来源于:http://johndunavent.com/combined-line-and-bar-chart-ggplot2

在那里,John Dunavent创建了一个名为theme_min的函数,可以编辑以提供ggplot的默认选项,包括使用通过windowsFonts命令导入的Windows字体。 我对他的代码进行了适应,如下所示:

theme_min = function (size=10, font=NA, face='plain', 
    panelColor=backgroundColor, axisColor='#999999', 
    gridColor=gridLinesColor, textColor='black') 
{
    theme_text = function(...)
        ggplot2::theme_text(family=font, face=face, colour=textColor, 
            size=size, ...)

opts(
    axis.text.x = theme_text(),
    axis.text.y = theme_text(),
    axis.line = theme_blank(),
    axis.ticks = theme_segment(colour=axisColor, size=0.25),
    panel.border = theme_rect(colour=backgroundColor),
    legend.background = theme_blank(),
    legend.key = theme_blank(),
    legend.key.size = unit(1.5, 'lines'),
    legend.text = theme_text(hjust=0),
    legend.title = theme_text(hjust=0),
    panel.background = theme_rect(fill=panelColor, colour=NA),
    panel.grid.major = theme_line(colour=gridColor, size=0.33),
    panel.grid.minor = theme_blank(),
    strip.background = theme_rect(fill=NA, colour=NA),
    strip.text.x = theme_text(hjust=0),
    strip.text.y = theme_text(angle=-90),
    plot.title = theme_text(hjust=0),
    plot.margin = unit(c(0.1, 0.1, 0.1, 0.1), 'lines'))
}

##Create a custom font type. Could be 'F', 'TEST', whatever
windowsFonts(F = windowsFont('Wide Latin'))

##and insert this line of code into the original code I list above: 
+ theme_min(font='F', size=10) 

尴尬的是,在创建绘图之前,我没有找到一种通用修改geom_text对象字体设置的方法。尽管如此,James上面的解决方案完美地解决了这个问题。我没有使用标准字体,而是使用fontfamily="F"来引入我在theme_min()中选择的自定义字体。

grid.gedit("GRID.text",gp=gpar(fontfamily="F"))

希望这对于其他想要修改图表字体的用户有所帮助。

感谢所有帮助我解决问题的人! Aaron

1
请注意,opts 命令在 ggplot2 中已被废弃一段时间。你应该(大多数情况下?)可以通过将 opts 替换为 theme 来使用上面的代码。一些元素规格,如 theme_text,可能需要更改为 element_text - Paul 'Joey' McMurdie
很好的使用了 'F' ;-) - PatrickT

11

请查看theme_text()函数的family参数。

dummy <- data.frame(A = rnorm(10), B = rnorm(10))
ggplot(dummy, aes(x = A, y = B)) + geom_point()
#helvetica = default
ggplot(dummy, aes(x = A, y = B)) + geom_point() + opts(axis.title.x = theme_text(family = "sans", face = "bold"))
#times
ggplot(dummy, aes(x = A, y = B)) + geom_point() + opts(axis.title.x = theme_text(family = "serif", face = "bold"))
#courier 
ggplot(dummy, aes(x = A, y = B)) + geom_point() + opts(axis.title.x = theme_text(family = "mono", face = "bold"))

1
非常感谢,Thierry——确实可以使用R标准字体库中包含的字体库来修改字体类型。现在需要想办法实现自定义字体。将查看其他帖子…… - aaron

5
kohske博客上的一篇文章启发,我想出了以下内容:
theme_set( theme_bw( base_family= "serif"))

theme_update( panel.grid.minor= theme_blank(),
             panel.grid.major= theme_blank(),
             panel.background= theme_blank(),
             axis.title.x= theme_blank(),
             axis.text.x= theme_text( family= "serif",
               angle= 90, hjust= 1 ),
             axis.text.x= theme_text( family= "serif"),
             axis.title.y= theme_blank())

theme_map <- theme_get()

theme_set( theme_bw())

现在当我想要使用那个特定的主题时:

last_plot() + theme_map

你的结果可能因人而异。

顺便说一句,如果我有权力,我会投票反对优选答案:

> grid.gedit("GRID.text",gp=gpar(fontfamily="mono"))
Error in editDLfromGPath(gPath, specs, strict, grep, global, redraw) :
  'gPath' (GRID.text) not found

我不确定这是什么意思。我也没有被提供一个评论那个答案的链接;也许网站上发生了一些变化。


1
嗨,尼尔,我在ggplot2方面仍然不是专家,但在我看来,你在这里提出的解决方案在使用R和ggplot2本地可用的字体/主题设置时效果很好。我需要能够为我的图表导入Windows库中的任何自定义字体,Brandon和James帮助我想出的解决方案非常完美。这是我如何使用grid.gedit:windowsFonts(F = windowsFont(chartFont))``grid.gedit("GRID.text",gp=gpar(fontfamily="F"))您需要确保所需的字体系列可用。 - aaron
@NeilBest 这个错误意味着你的图中没有任何文本层 - 也就是说你没有使用 geom_text - James
1
这似乎不再起作用(至少对我来说是这样)。但一个可行的解决方法是:theme_map$text$family = 'new font' - geotheory

2
您可以使用grid.gedit来设置由geom_text产生的标签的字体:
grid.gedit("GRID.text",gp=gpar(fontfamily="mono"))

在您生成原始图后调用此函数。

非常好的评论,谢谢大家。Brandon,你的建议非常准确,只是我在使用http://johndunavent.com/combined-line-and-bar-chart-ggplot2中找到的方法来修改geom_text字体标签时遇到了问题。James,不确定你是否熟悉那篇文章,但我如何使用你的解决方案(完美地解决了问题)来使用通过windowsFonts()命令引入到R中的字体修改geom_text标签字体?感谢您的帮助!Jeff,在这里如果我继续遇到困难,将会尝试Cairo。 - aaron
windowsFonts(Verdana="TT Verdana") 然后您可以使用 fontfamily="Verdana"。您还可以通过第一个参数设置轴标签和标题,例如 "axis.text""axis.title"。顺便说一下,那个链接已经失效了,但是您仍然可以通过谷歌缓存获得一些信息。 - James

0

对我来说,这似乎是最简单的解决方案。

在数据框中有一些玩耍的数据,并制成一个简单的图形“p”,具有漂亮的长x和y标签,以便我们可以看到字体的变化:

df <- data.frame(A = rnorm(10), B = rnorm(10))
p = ggplot(data = df, aes(x = A, y = B)) + geom_point()
p = p + xlab("A long x-string so we can see the effect of the font switch")
p = p + ylab("Likewise up the ordinate")

然后我们以默认字体查看绘图:

p 

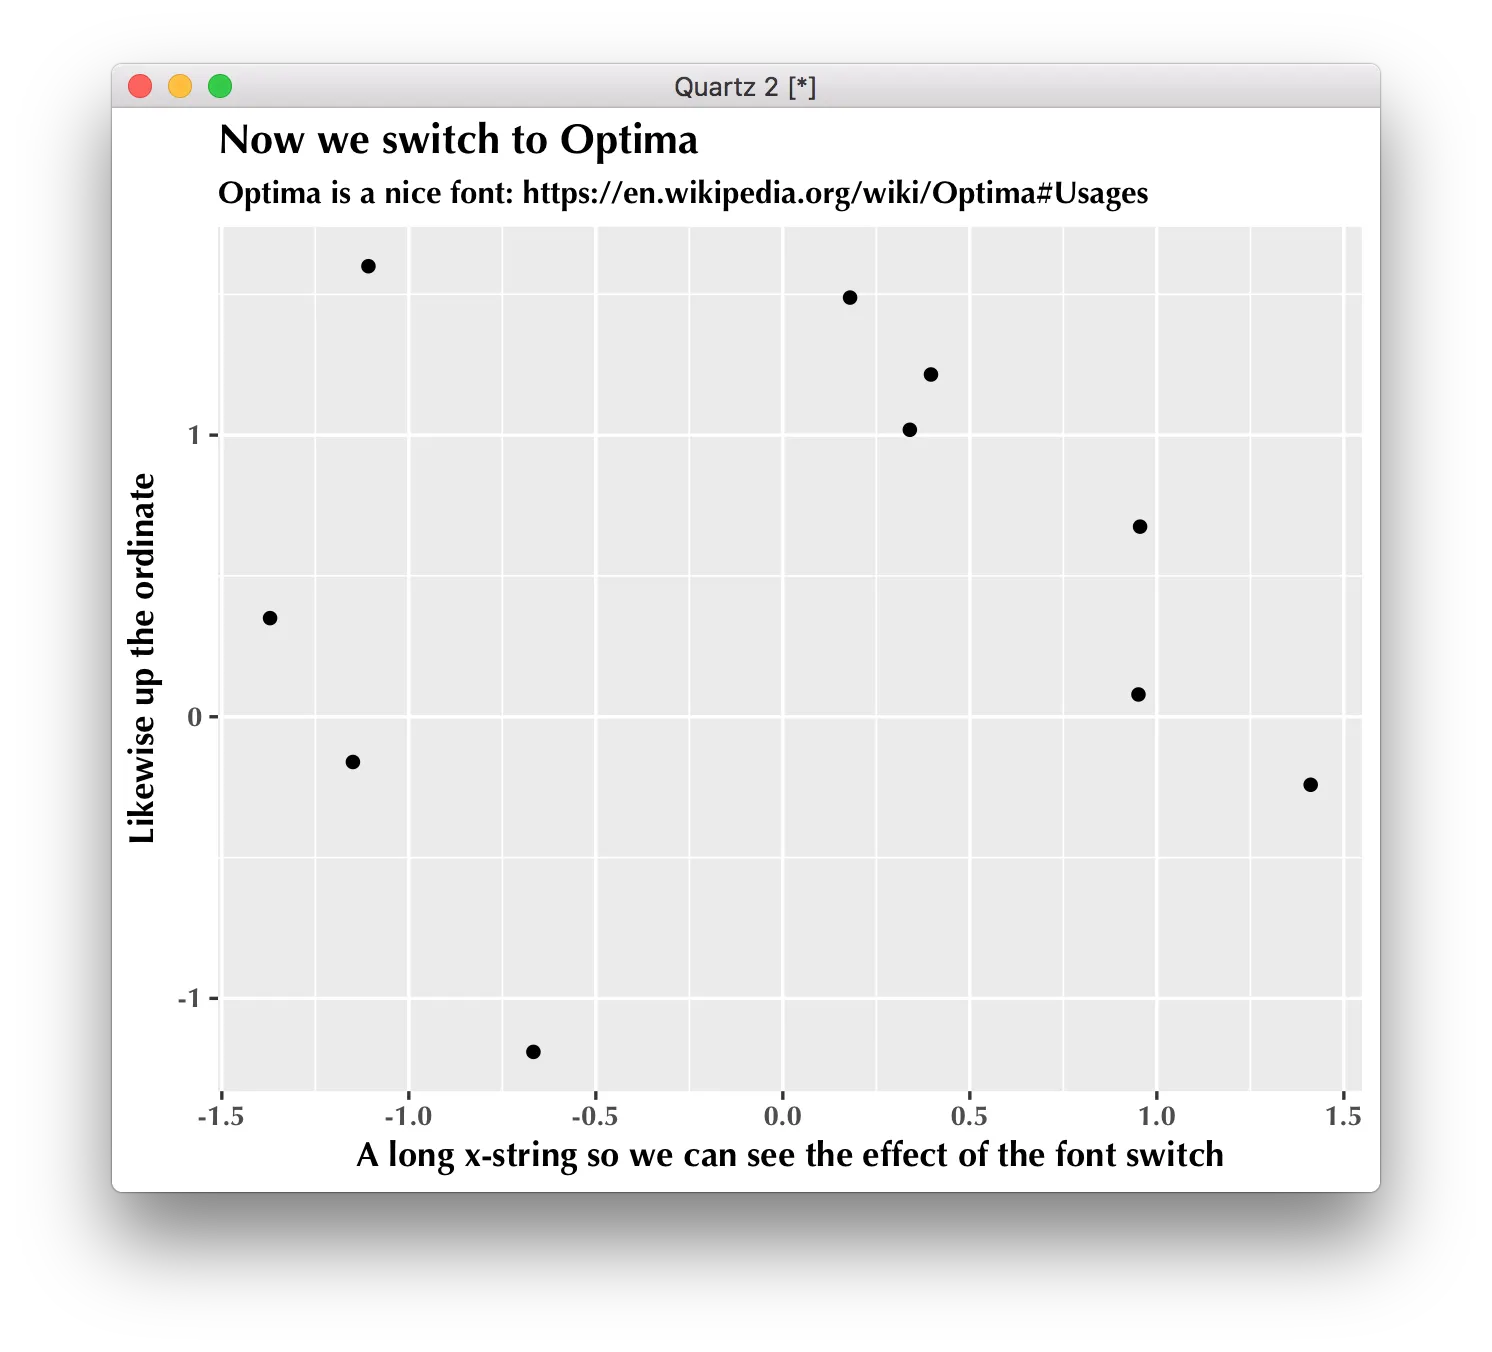
现在我们切换到Optima,添加一些漂亮的标题和副标题,沉浸在Optima的荣耀中:

label = "Now we switch to Optima"
subtitle = "Optima is a nice font: https://en.wikipedia.org/wiki/Optima#Usages"

最后,我们使用新字体进行打印

# the only line you need to read:
p + theme(text = element_text(family = "Optima", , face = "bold"))
p = p + ggtitle(label = label, subtitle = subtitle)
p

graph in optima font


1
嘿@tim,ggplot2带有内置字体选项。这个问题涉及到当您想要从系统中导入ggplot2不可用的字体时的情况。 - aaron

0

网页内容由stack overflow 提供, 点击上面的
可以查看英文原文,
原文链接