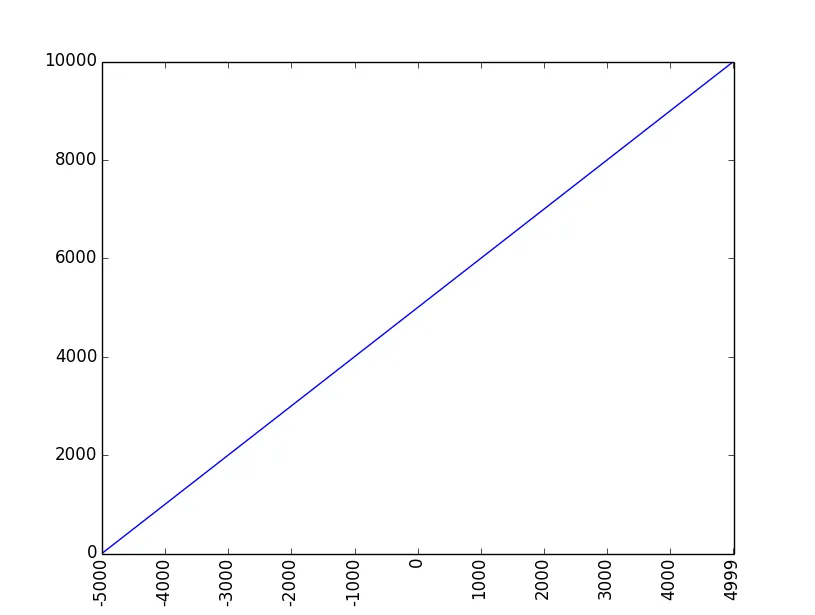
第一个加载的图表在X轴上有太多的刻度(参见image01)。
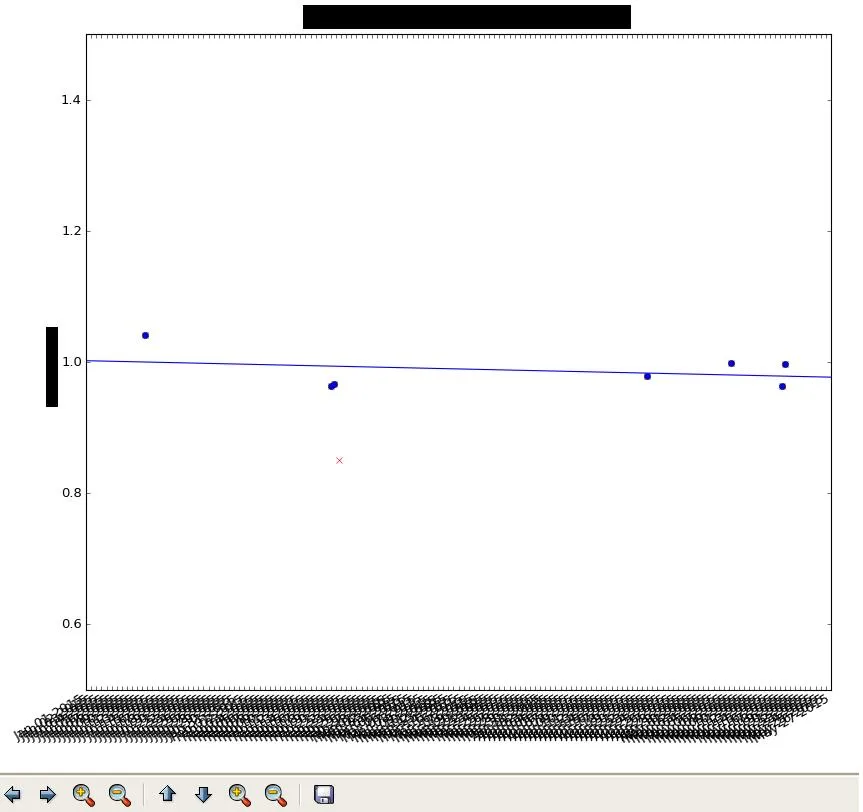
如果我在X轴上使用缩放操作,那么该图表现在就可以正常加载了。
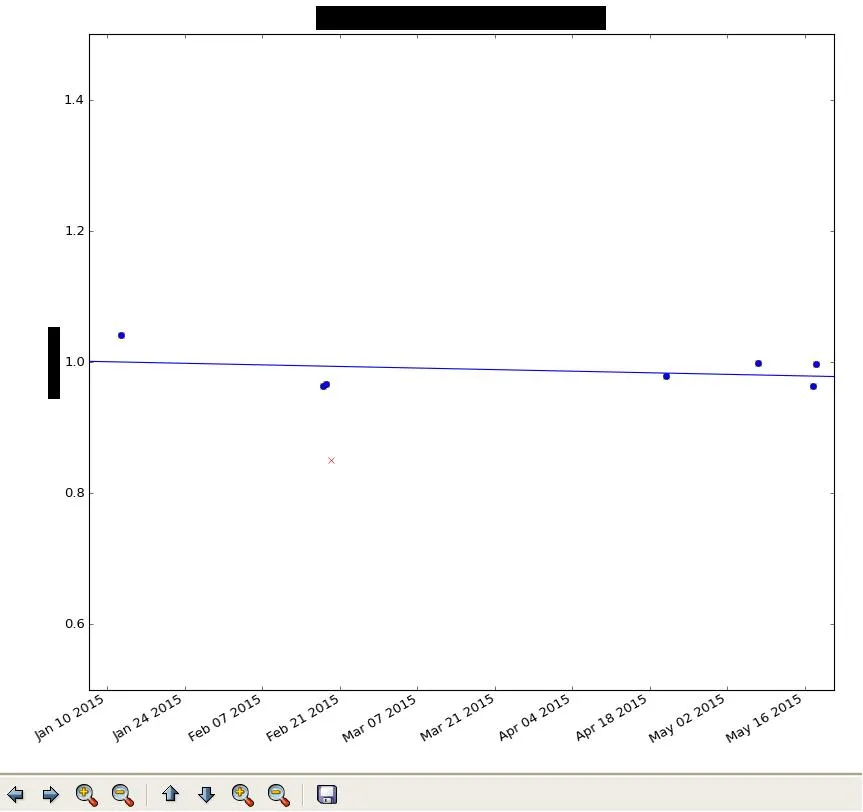
您能否给我一些建议,因为Plot构造参数似乎很好。
date_range = (735599.0, 735745.0)
x = (735610.5, 735647.0, 735647.5, 735648.5, 735669.0, 735699.0, 735701.5, 735702.5, 735709.5, 735725.5, 735728.5, 735735.5, 735736.0)
y = (227891.25361545716, 205090.4880046467, 208352.59317388065, 175462.99296699322, 98209.836461969651, 275063.37219361769, 219456.93600708069, 230731.12613806152, 209043.19805037521, 218297.51486296533, 208036.88967207001, 206311.71988471842, 216036.56824433553)
y0 = 218206.79192
x_after = (735610.5, 735647.0, 735647.5, 735701.5, 735702.5, 735709.5, 735725.5, 735728.5, 735735.5, 735736.0)
y_after = (227891.25361545716, 205090.4880046467, 208352.59317388065, 219456.93600708069, 230731.12613806152, 209043.19805037521, 218297.51486296533, 208036.88967207001, 206311.71988471842, 216036.56824433553)
linex = -39.1175584541
liney = 28993493.5251

ax.plot_date(x, numpy.array(y) / y0, color='r', xdate=True, marker='x')
ax.plot_date(x_after, numpy.array(y_after) / y0, color='r', xdate=True)
ax.set_xlim(date_range)
steps = list(ax.get_xlim())
steps.append(steps[-1] + 2)
steps = [steps[0] - 2] + steps
ax.plot(steps, numpy.array([linex * a + liney for a in steps]) / y0, color='b')
感谢你的帮助。 曼努埃尔