在搜索了三天网络没有成功后,我在这里发布了这个问题。希望能在这里得到答案。请不要删除这篇帖子,因为我在这里也没有找到答案。谢谢。
我有两个文件:
- 栅格图像文件(即,Air temperature 2020-01-01.tif)
- 世界国家边界形状文件(即,World_Countries_base_map.shp)
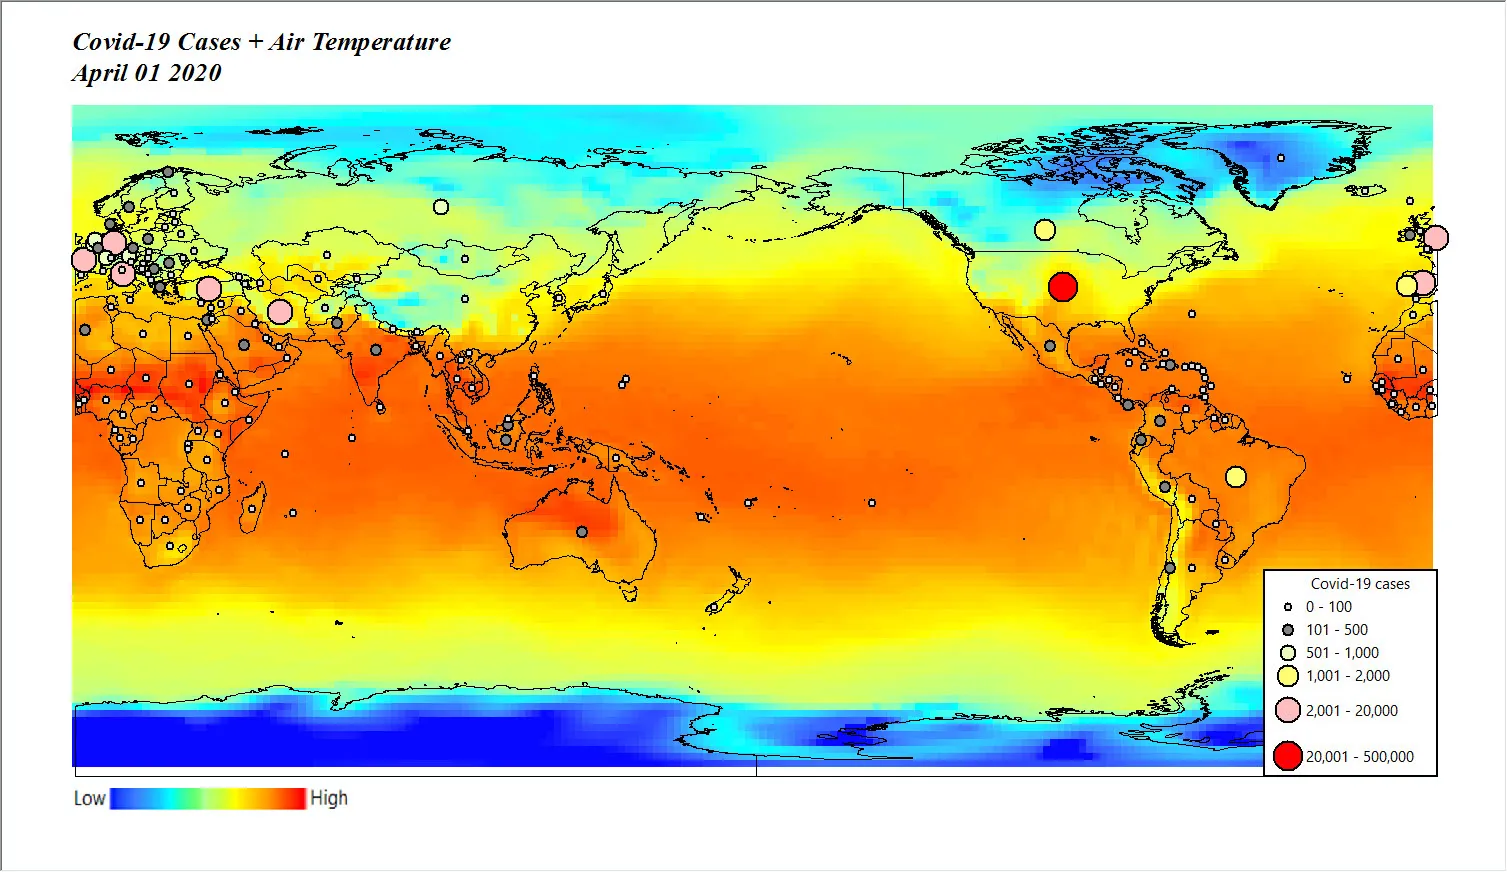
目标:我想在栅格文件上面绘制形状文件,然后将绘图保存为Jpeg文件格式,最终得到像这样的东西:
我在Python方面还很新,使用Spyder准备了这个简单的代码:
# Import needed packages
import os
import rasterio
import matplotlib.pyplot as plt
import geopandas as gpd
import earthpy as et
from matplotlib import pyplot
## list all raster images in tiff format in the folder:
list_files = [f for f in
os.listdir('C:/Users/Desktop/Question/Raster_Air_temp')
if '.tif' in f]
print(list_files[1]) # checking the 1st file in the list
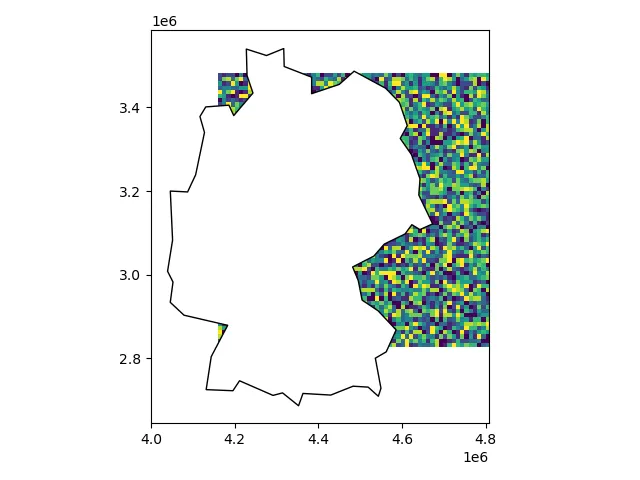
## reading the first tiff file:
raster_image = rasterio.open(list_files[1])
## plot it
draft_output = pyplot.imshow(raster_image.read(1), cmap='jet')
## importing world shapefile
World_map = gpd.read_file('C:/Users/Desktop/Question/World_shapefile/World_Countries_base_map.shp')
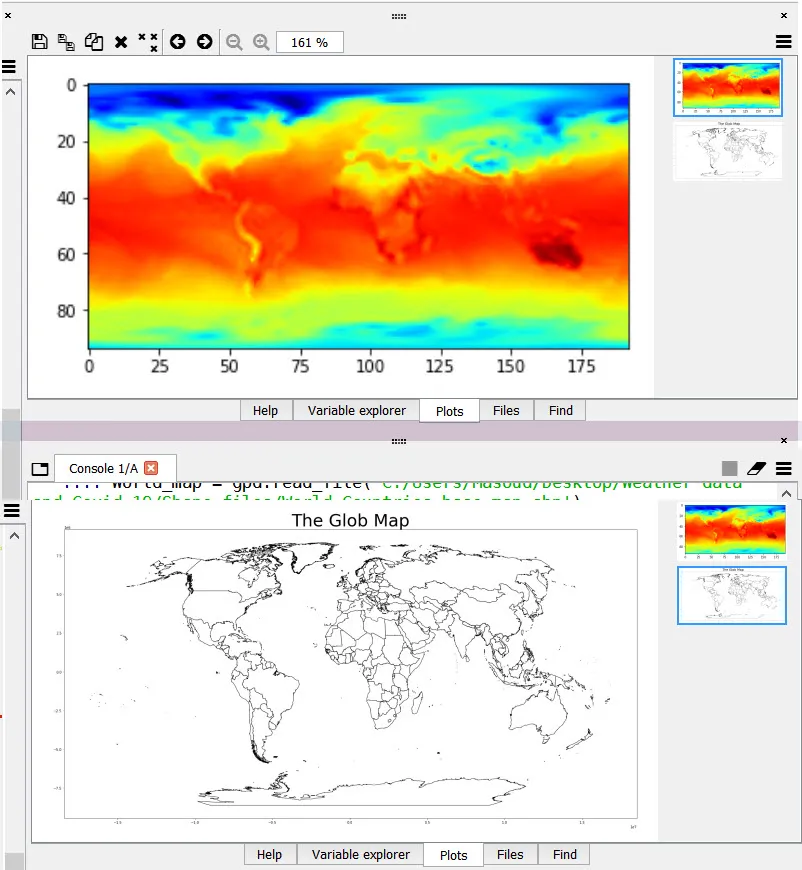
# plot World shapefile
fig, ax = plt.subplots(figsize = (30,30)) # image size and quality can be controled by figsize
ax.set_title('The Glob Map', fontsize=50);
World_map.plot(ax=ax, color='white', edgecolor='black') # colors note at https://matplotlib.org/tutorials/colors/colormaps.html
plt.show()
## Plot both World shapefile and raster image in one graph:
????
问题:我应该如何在代码的????部分输入正确的代码以达到我的目标(上述提到)? 感谢所有的评论和帮助。
在这里,我分享两个文件,以便那些想要帮助的人更容易地使用。 从我的Dropbox下载文件
.