例如,这是我的测试数据。
我可以获取类似这样的摘要数据。
test = spark.createDataFrame([
    (0, 1, 5, "2018-06-03", "Region A"),
    (1, 1, 2, "2018-06-04", "Region B"),
    (2, 2, 1, "2018-06-03", "Region B"),
    (3, 3, 1, "2018-06-01", "Region A"),
    (3, 1, 3, "2018-06-05", "Region A"),
])\
  .toDF("orderid", "customerid", "price", "transactiondate", "location")
test.show()
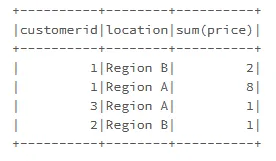
我可以获取类似这样的摘要数据。
test.groupBy("customerid", "location").agg(sum("price")).show()
但我也想要百分比数据,类似于这样
+----------+--------+----------+
|customerid|location|sum(price)| percentage
+----------+--------+----------+
|         1|Region B|         2|    20%
|         1|Region A|         8|    80%
|         3|Region A|         1|    100%
|         2|Region B|         1|    100%
+----------+--------+----------+
我想知道:
- 我应该怎么做?也许可以使用窗口函数?
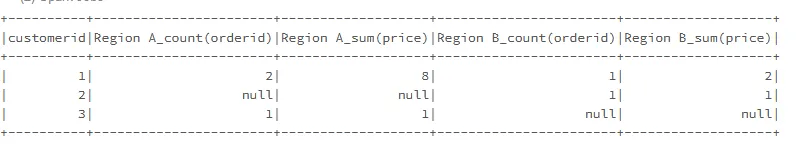
- 我能否将透视表转化为像这样的形式?(带有百分比和总和列)
我只在Pandas中如何在groupby后获取一列计数的百分比中找到了一个示例。
更新:
在@Gordon Linoff的帮助下,我可以通过以下方式获得百分比:
from pyspark.sql.window import Window
test.groupBy("customerid", "location").agg(sum("price"))\
  .withColumn("percentage", col("sum(price)")/sum("sum(price)").over(Window.partitionBy(test['customerid']))).show()