我有两个数据帧,想要按组/分区将它们连接起来。如何在PySpark中实现?
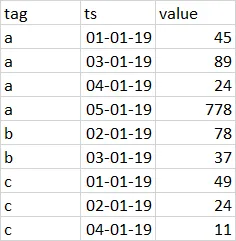
第一个数据帧包含3个时间序列,由id、时间戳和值标识。请注意,时间序列中包含一些间隔(缺失的天数)。
第一个数据帧包含3个时间序列,由id、时间戳和值标识。请注意,时间序列中包含一些间隔(缺失的天数)。
在第二个数据框上使用coalesce的Left join将适用于这种情况。
示例:
df.show()
#---+--------+-----+
#tag|      ts|value|
#---+--------+-----+
#  a|01-01-19|   45|
#  a|03-01-19|   89|
#  a|04-01-19|   24|
#  a|05-01-19|  778|
#---+--------+-----+

df1.show()
#+--------+
#|      ts|
#+--------+
#|01-01-19|
#|02-01-19|
#|03-01-19|
#|04-01-19|
#|05-01-19|
#+--------+

df1.alias("t1").join(df.alias("t2"),col("t1.ts")==col("t2.ts"),"left").\
selectExpr("coalesce(t1.ts,t2.ts) as ts","tag","value").\
orderBy("ts").\
show()

#+--------+----+-----+
#|      ts| tag|value|
#+--------+----+-----+
#|01-01-19|   a|   45|
#|02-01-19|null| null|
#|03-01-19|   a|   89|
#|04-01-19|   a|   24|
#|05-01-19|   a|  778|
#+--------+----+-----+
df2 = (
df2
.withColumn("tag", F.array([F.lit("a"), F.lit("b"), F.lit("c")]))
.withColumn("ts", F.explode("ts"))
)
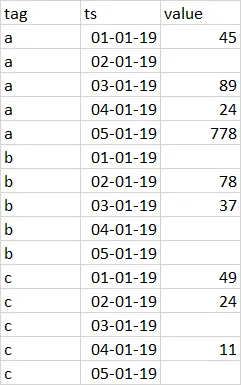
df_out = df1.join(df2, ["tag","ts"], "outer")