如果这是一个愚蠢的问题,我很抱歉,但是在Python中使用matplotlib.pyplot绘制椭圆有没有简单的方法?我希望有类似于matplotlib.pyplot.arrow的东西,但我找不到任何东西。
唯一的方法是使用matplotlib.patches和draw_artist或类似的东西吗?我希望有更简单的方法,但文档并没有提供太多帮助。
如果这是一个愚蠢的问题,我很抱歉,但是在Python中使用matplotlib.pyplot绘制椭圆有没有简单的方法?我希望有类似于matplotlib.pyplot.arrow的东西,但我找不到任何东西。
唯一的方法是使用matplotlib.patches和draw_artist或类似的东西吗?我希望有更简单的方法,但文档并没有提供太多帮助。
import numpy as np
from matplotlib import pyplot as plt
from math import pi
u=1. #x-position of the center
v=0.5 #y-position of the center
a=2. #radius on the x-axis
b=1.5 #radius on the y-axis
t = np.linspace(0, 2*pi, 100)
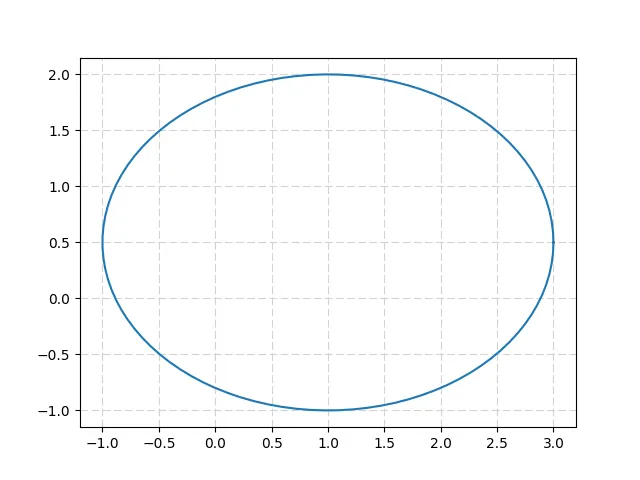
plt.plot( u+a*np.cos(t) , v+b*np.sin(t) )
plt.grid(color='lightgray',linestyle='--')
plt.show()
这给出了一个椭圆,其参数方程为:
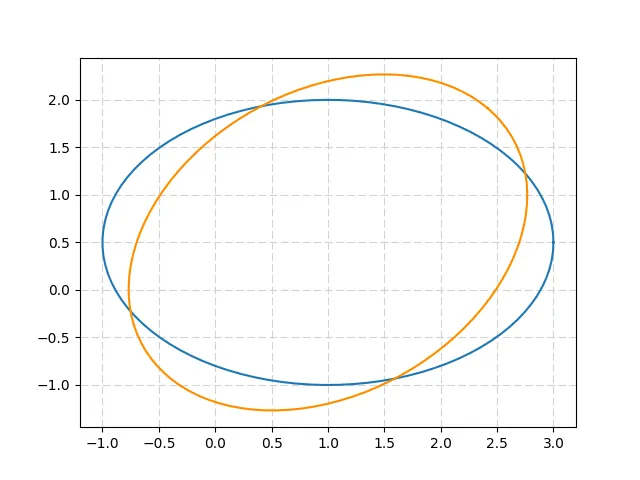
通过二维旋转矩阵,可以旋转椭圆:
import numpy as np
from matplotlib import pyplot as plt
from math import pi, cos, sin

u=1.       #x-position of the center
v=0.5      #y-position of the center
a=2.       #radius on the x-axis
b=1.5      #radius on the y-axis
t_rot=pi/4 #rotation angle

t = np.linspace(0, 2*pi, 100)
Ell = np.array([a*np.cos(t) , b*np.sin(t)])
     #u,v removed to keep the same center location
R_rot = np.array([[cos(t_rot) , -sin(t_rot)],[sin(t_rot) , cos(t_rot)]])
     #2-D rotation matrix

Ell_rot = np.zeros((2,Ell.shape[1]))
for i in range(Ell.shape[1]):
    Ell_rot[:,i] = np.dot(R_rot,Ell[:,i])

plt.plot( u+Ell[0,:] , v+Ell[1,:] )     #initial ellipse
plt.plot( u+Ell_rot[0,:] , v+Ell_rot[1,:],'darkorange' )    #rotated ellipse
plt.grid(color='lightgray',linestyle='--')
plt.show()
Matplotlib椭圆演示很好。但是我没有使用for循环就无法在我的代码中实现它。我遇到了轴图形错误。相反,这是我所做的,当然,xy中心是我的自己坐标,宽度和高度基于我绘制椭圆的图像。
from matplotlib.patches import Ellipse

plt.figure()
ax = plt.gca()

ellipse = Ellipse(xy=(157.18, 68.4705), width=0.036, height=0.012,
                        edgecolor='r', fc='None', lw=2)
ax.add_patch(ellipse)
这段代码部分基于此页面上的第一个代码框。有关matplotlib.patches.Ellipse的链接,请参见上面Chris的回复。
matplotlib.patches.Ellipse)会产生非常高效的代码。使用np.linspace进行暴力绘图可能会产生非常大的文件大小,这可能会减慢某些应用程序甚至触发Latex编译器中的错误。 - C-3PO你看过matplotlib椭圆演示吗?他们使用了matplotlib.patches.Ellipse来制作。
matplotlib.pyplot API文档进行搜索并未发现任何内容,所以恐怕您只能使用matplotlib.patches.Ellipse了。 - Chris