我正在尝试创建一个分组堆叠柱状图。
目前,我有以下DataFrame:
>>> df
                                       Value
Rating                                 1          2         3
Context Parameter
Total   1                          43.312347   9.507902  1.580367
        2                          42.862649   9.482205  1.310549
        3                          43.710651   9.430811  1.400488
        4                          43.209559   9.803418  1.349094
        5                          42.541436  10.008994  1.220609
        6                          42.978286   9.430811  1.336246
        7                          42.734164  10.317358  1.606064
User    1                          47.652348  11.138861  2.297702
        2                          47.102897  10.589411  1.848152
        3                          46.853147  10.139860  1.848152
        4                          47.252747  11.138861  1.748252
        5                          45.954046  10.239760  1.448551
        6                          46.353646  10.439560  1.498501
        7                          47.102897  11.338661  1.998002
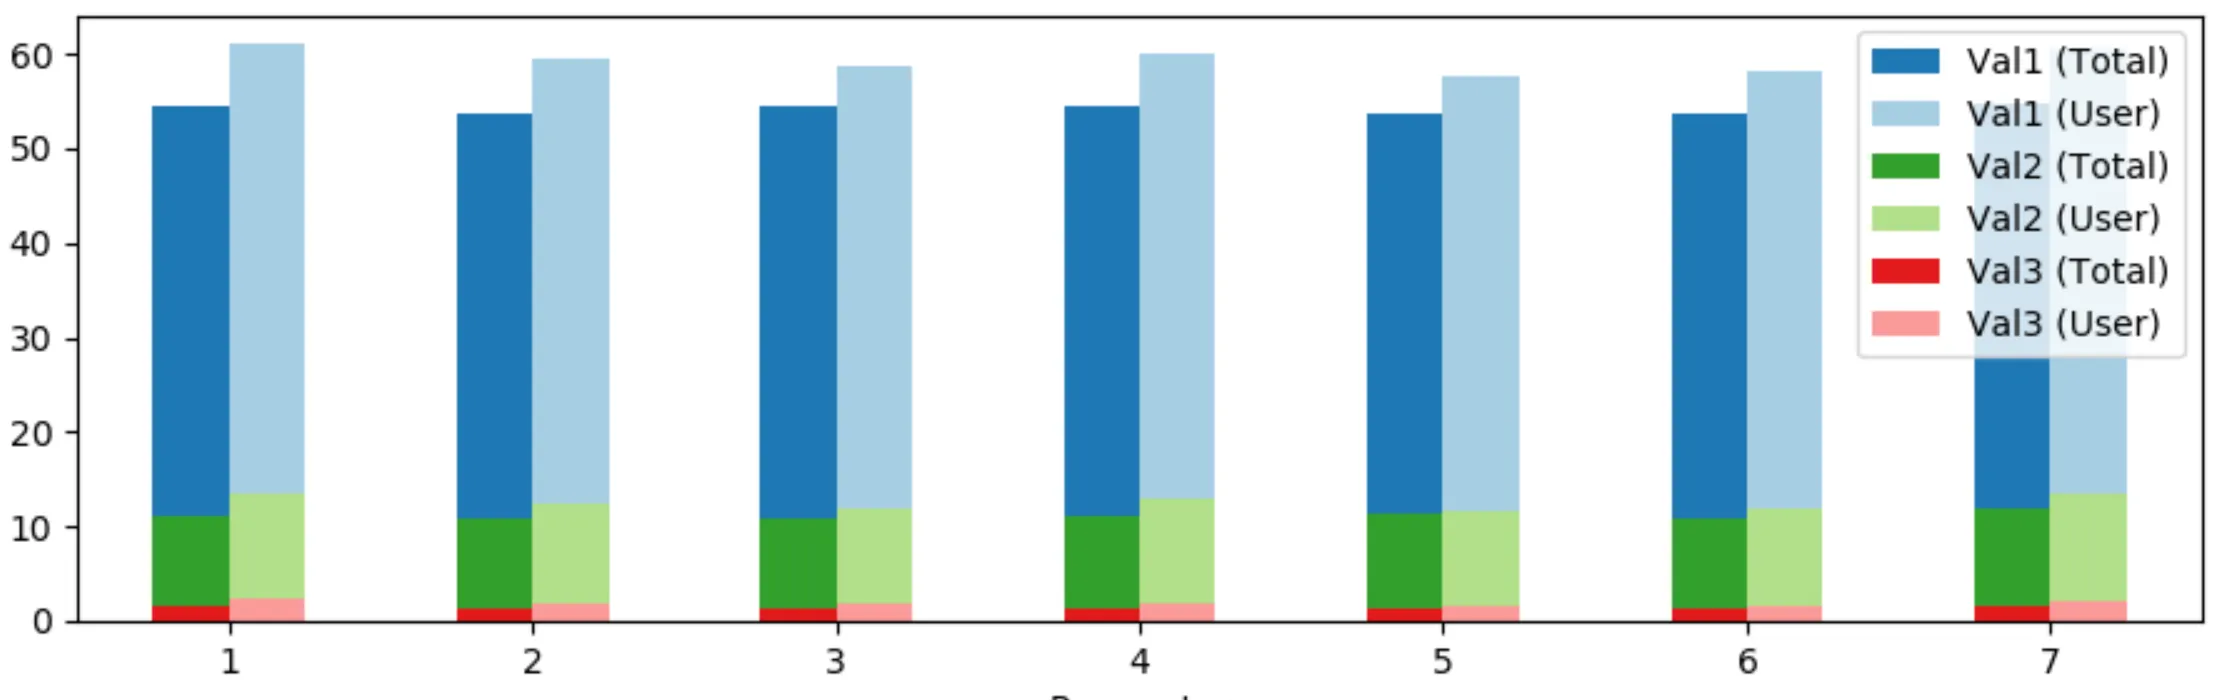
我想为每个参数分组在一起的总计和用户条形图。
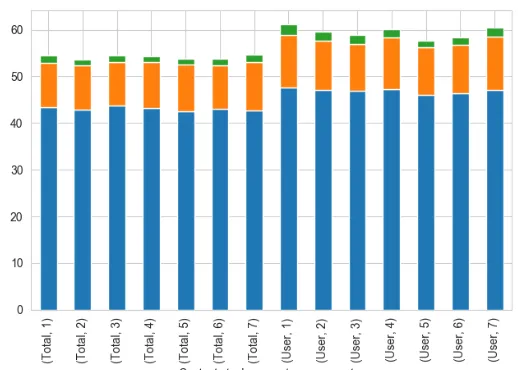
这是使用
df.plot(kind='bar', stacked=True)生成的图表:
这些条看起来没问题,但是我怎么才能让总计和用户的条并排显示,对于每个参数最好有一些间距?