我有一组时间序列数据,并想展示自相关函数。(我们知道正弦函数的自相关是余弦函数)
我尝试了几种如下方式:
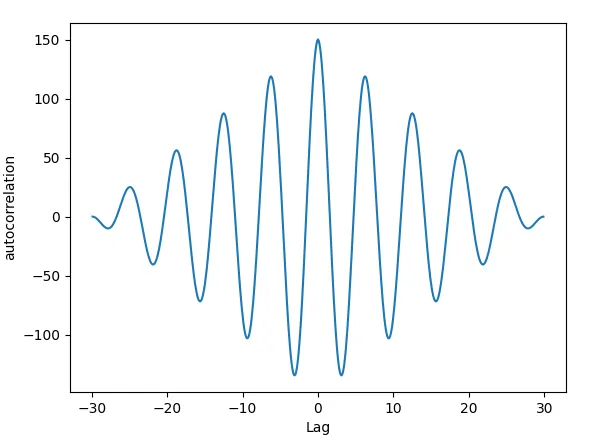
然而,结果是一个衰减的余弦函数,而不是一个纯的cos(x)函数。有些答案说这是因为在计算自相关时包填充了x区域外的零,但如何修复才能得到一个纯的cos(x)呢?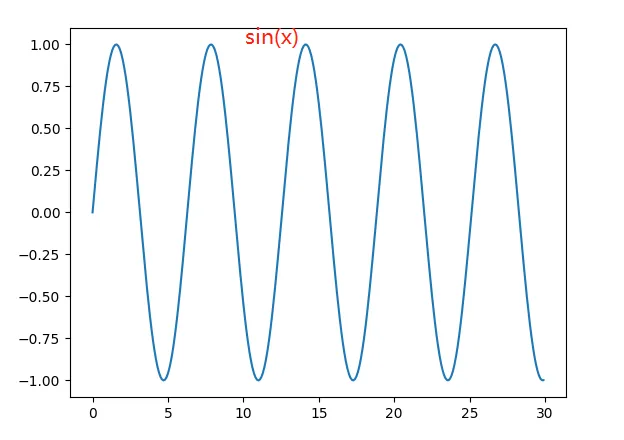

我尝试了几种如下方式:
import numpy as np
import matplotlib.pyplot as plt
from statsmodels.graphics.tsaplots import plot_acf, plot_pacf
x = np.arange(0,30,0.1) #interval=0.1, 300 samples
y = np.sin(x)
y_cor = np.correlate(y,y,'full')
lags = np.arange(-x[-1],x[-1]+0.1,0.1)
#sin(x)
plt.figure()
plt.plot(x,y)
#autocorrelation(numpy)
plt.figure()
plt.plot(lags,y_cor)
plt.xlabel('Lag')
plt.ylabel('autocorrelation')
#matplotlib
plt.figure()
plt.acorr(y,maxlags=y.size-1)
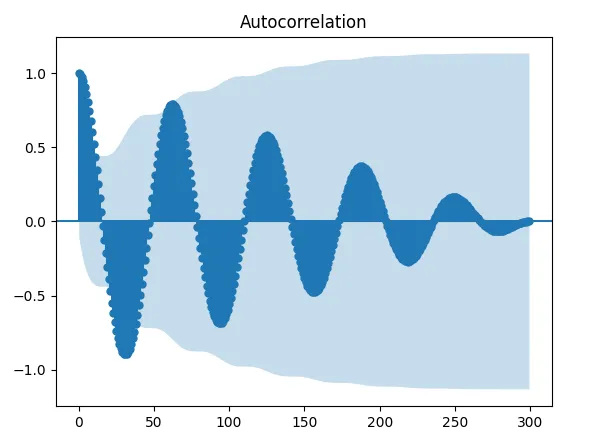
#statsmodels
plt.figure()
plot_acf(y,lags=y.size-1)
plt.show()
然而,结果是一个衰减的余弦函数,而不是一个纯的cos(x)函数。有些答案说这是因为在计算自相关时包填充了x区域外的零,但如何修复才能得到一个纯的cos(x)呢?