改进波形检测算法

3
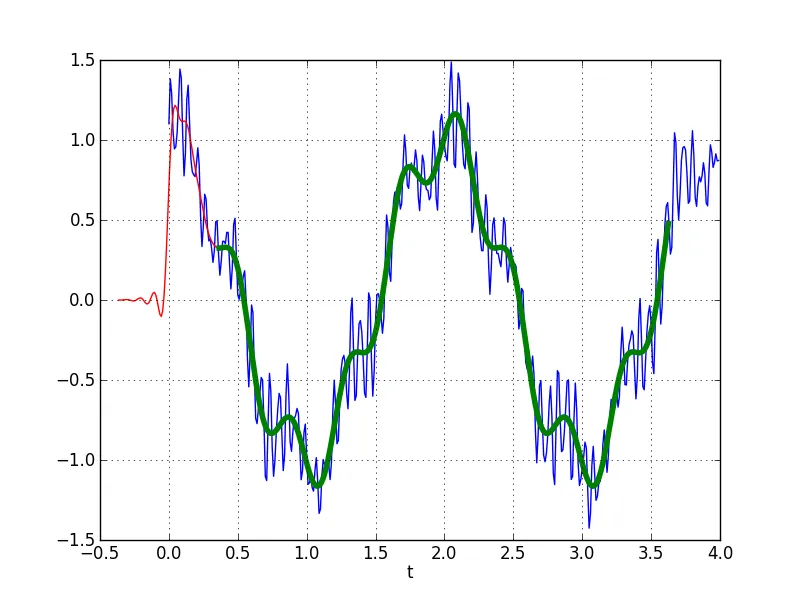
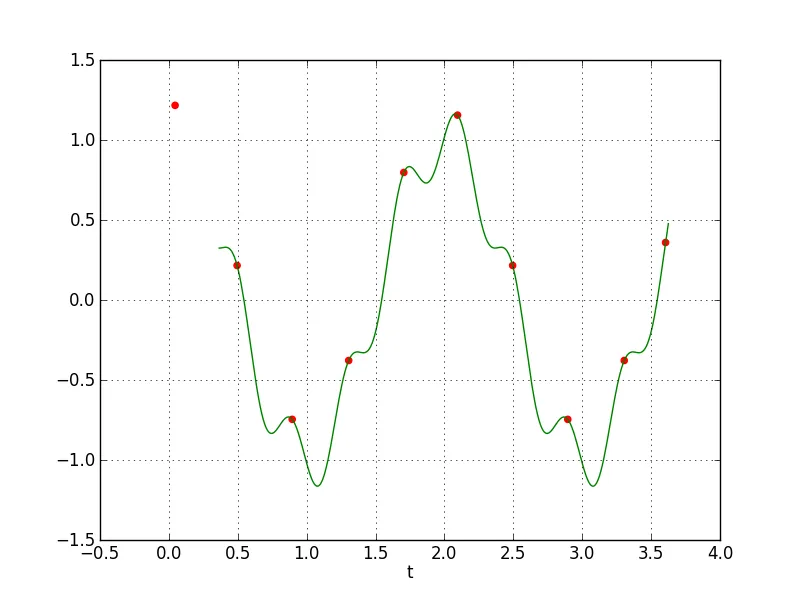
我是Python和编程的新手,正在我的样条插值图上工作波峰检测算法。我使用了此链接中给出的代码:https://gist.github.com/endolith/250860。我必须使此算法适用于任何类型的波形,即低振幅、高振幅,基线不对齐等。目标是计算绘图中的波数。但我的峰值检测会计算“无效”的峰值,从而得出错误答案。所谓“无效”峰值是指如果两个凹槽靠得很近位于波峰上,程序将检测到2个峰值,也就是说有2个波浪,实际上只有1个波浪。我尝试更改在链接中给出的峰值检测函数中定义的“delta”参数,但这并没有解决我正在努力达成的一般化目标。请建议任何改进算法或我应该使用的其他方法。欢迎任何形式的帮助。提前致谢。
注:我无法上传错误检测到的波形图像。我希望我的解释足够清楚... 以下是代码。
wave = f1(xnew)/(max(f1(xnew))) ##interpolated wave
maxtab1, mintab1 = peakdet(wave,.005) 
maxi = max(maxtab1[:,1])
for i in range(len(maxtab1)):
    if maxtab1[i,1] > (.55 * maxi) : ## Thresholding
        maxtab.append((maxtab1[i,0],maxtab1[i,1]))
arr_maxtab = np.array(maxtab)
dist = 1500 ## Threshold defined for minimum distance between two notches to be considered as two separate waves
mtdiff = diff(arr_maxtabrr[:,0])
final_maxtab = []
new_arr = []
for i in range(len(mtdiff)):
if mtdiff[i] < dist :
            new_arr.append((arr_maxtab[i+1,0],arr_maxtab[i+1,1])) 
for i in range(len(arr_maxtab)):
if  not arr_maxtab[i,0] in new_arr[:,0]:
    final_maxtab.append((arr_maxtab[i,0], arr_maxtab[i,1]))
else:
final_maxtab = maxtab

1
请发布导致问题的代码,并说明结果与您的期望有何不同。 - digital_revenant
1
http://tinypic.com/ - 尝试使用这个资源上传图片。我认为你不能为所有问题创建通用的峰值检测器。 - Rodion Gorkovenko
@Rodion Gorkovenko 我需要10个声望才能上传图片..很快我就会有了。 - pypro
1个回答

3
能够区分凹口和真正的峰值意味着你在峰值之间有一个基本间距。换句话说,有一个最小的频率分辨率,你希望在这个分辨率下运行峰值检测搜索。如果你放大一个信号,在这个信号中,你比噪声地板窄得多,你会观察到看似每隔几个样本就会出现“峰”的锯齿形状。
你想做的是以下事情:
1. 平滑信号。 2. 找到“真正”的峰值。
更精确地说,
1. 通过低通滤波器处理信号。 2. 在可接受的峰宽范围内找到信噪比足够的峰值。
第一步:低通滤波
为了完成第一步,我建议您使用scipy提供的信号处理工具
我改编了这个食谱条目,展示了如何使用scipy使用FIR滤波器对信号进行低通处理。
from numpy import cos, sin, pi, absolute, arange, arange
from scipy.signal import kaiserord, lfilter, firwin, freqz, find_peaks_cwt
from pylab import figure, clf, plot, xlabel, ylabel, xlim, ylim, title, grid, axes, show, scatter

#------------------------------------------------
# Create a signal. Using wave for the signal name.
#------------------------------------------------

sample_rate = 100.0
nsamples = 400
t = arange(nsamples) / sample_rate
wave = cos(2*pi*0.5*t) + 0.2*sin(2*pi*2.5*t+0.1) + \
        0.2*sin(2*pi*15.3*t) + 0.1*sin(2*pi*16.7*t + 0.1) + \
            0.1*sin(2*pi*23.45*t+.8)


#------------------------------------------------
# Create a FIR filter and apply it to wave.
#------------------------------------------------

# The Nyquist rate of the signal.
nyq_rate = sample_rate / 2.0

# The desired width of the transition from pass to stop,
# relative to the Nyquist rate.  We'll design the filter
# with a 5 Hz transition width.
width = 5.0/nyq_rate

# The desired attenuation in the stop band, in dB.
ripple_db = 60.0

# Compute the order and Kaiser parameter for the FIR filter.
N, beta = kaiserord(ripple_db, width)

# The cutoff frequency of the filter.
cutoff_hz = 10.0

# Use firwin with a Kaiser window to create a lowpass FIR filter.
taps = firwin(N, cutoff_hz/nyq_rate, window=('kaiser', beta))

# Use lfilter to filter x with the FIR filter.
filtered_x = lfilter(taps, 1.0, wave)

enter image description here

步骤二:峰值检测

对于第二步,我建议您使用scipy提供的小波变换峰值检测器。您需要将过滤后的信号和一个从最小到最大可能峰宽的向量作为输入。该向量将用作小波变换的基础。

#------------------------------------------------
# Step 2: Find the peaks
#------------------------------------------------

figure(4)
plot(t[N-1:]-delay, filtered_x[N-1:], 'g', linewidth=1)

peakind = find_peaks_cwt(filtered_x, arange(3,20))
scatter([t[i] - delay for i in peakind], [filtered_x[i] for i in peakind], color="red")
for i in peakind:
    print t[i] + delay

xlabel('t')
grid(True)

show()

enter image description here


网页内容由stack overflow 提供, 点击上面的
可以查看英文原文,
原文链接