我将使用ggplot在时间序列中绘制多条趋势线(每十年一条)。
以下是数据:
dat <- structure(list(YY = 1961:2010, a = c(98L, 76L, 83L, 89L, 120L,
107L, 83L, 83L, 92L, 104L, 98L, 91L, 81L, 69L, 86L, 76L, 85L,
86L, 70L, 81L, 77L, 89L, 60L, 80L, 94L, 66L, 77L, 85L, 77L, 80L,
79L, 79L, 65L, 70L, 80L, 87L, 84L, 67L, 106L, 129L, 95L, 79L,
67L, 105L, 118L, 85L, 86L, 103L, 97L, 106L)), .Names = c("YY",
"a"), row.names = c(NA, -50L), class = "data.frame")
以下是脚本:
这里是脚本:
p <- ggplot(dat, aes(x = YY))
p <- p + geom_line(aes(y=a),colour="blue",lwd=1)
p <- p + geom_point(aes(y=a),colour="blue",size=2)

p <- p + theme(panel.background=element_rect(fill="white"),
         plot.margin = unit(c(0.5,0.5,0.5,0.5),"cm"),
         panel.border=element_rect(colour="black",fill=NA,size=1),
         axis.line.x=element_line(colour="black"),
         axis.line.y=element_line(colour="black"),
         axis.text=element_text(size=15,colour="black",family="serif"),
         axis.title=element_text(size=15,colour="black",family="serif"),
         legend.position = "top")

p <- p + scale_x_discrete(limits = c(seq(1961,2010,5)),expand=c(0,0))

p <- p + geom_smooth(data=dat[1:10,],aes(x=YY,y=a),method="lm",se=FALSE,color="black",formula=y~x,linetype="dashed")

p <- p + geom_smooth(data=dat[11:20,],aes(x=YY,y=a),method="lm",se=FALSE,color="black",formula=y~x,linetype="dashed")

p <- p + geom_smooth(data=dat[21:30,],aes(x=YY,y=a),method="lm",se=FALSE,color="black",formula=y~x,linetype="dashed")

p <- p + geom_smooth(data=dat[31:40,],aes(x=YY,y=a),method="lm",se=FALSE,color="black",formula=y~x,linetype="dashed")

p <- p + geom_smooth(data=dat[41:50,],aes(x=YY,y=a),method="lm",se=FALSE,color="black",formula=y~x,linetype="dashed")

p <- p + labs(x="Year",y="Number of Days")
outImg <- paste0("test",".png")
ggsave(outImg,p,width=8,height=5)
以下是生成的图片:
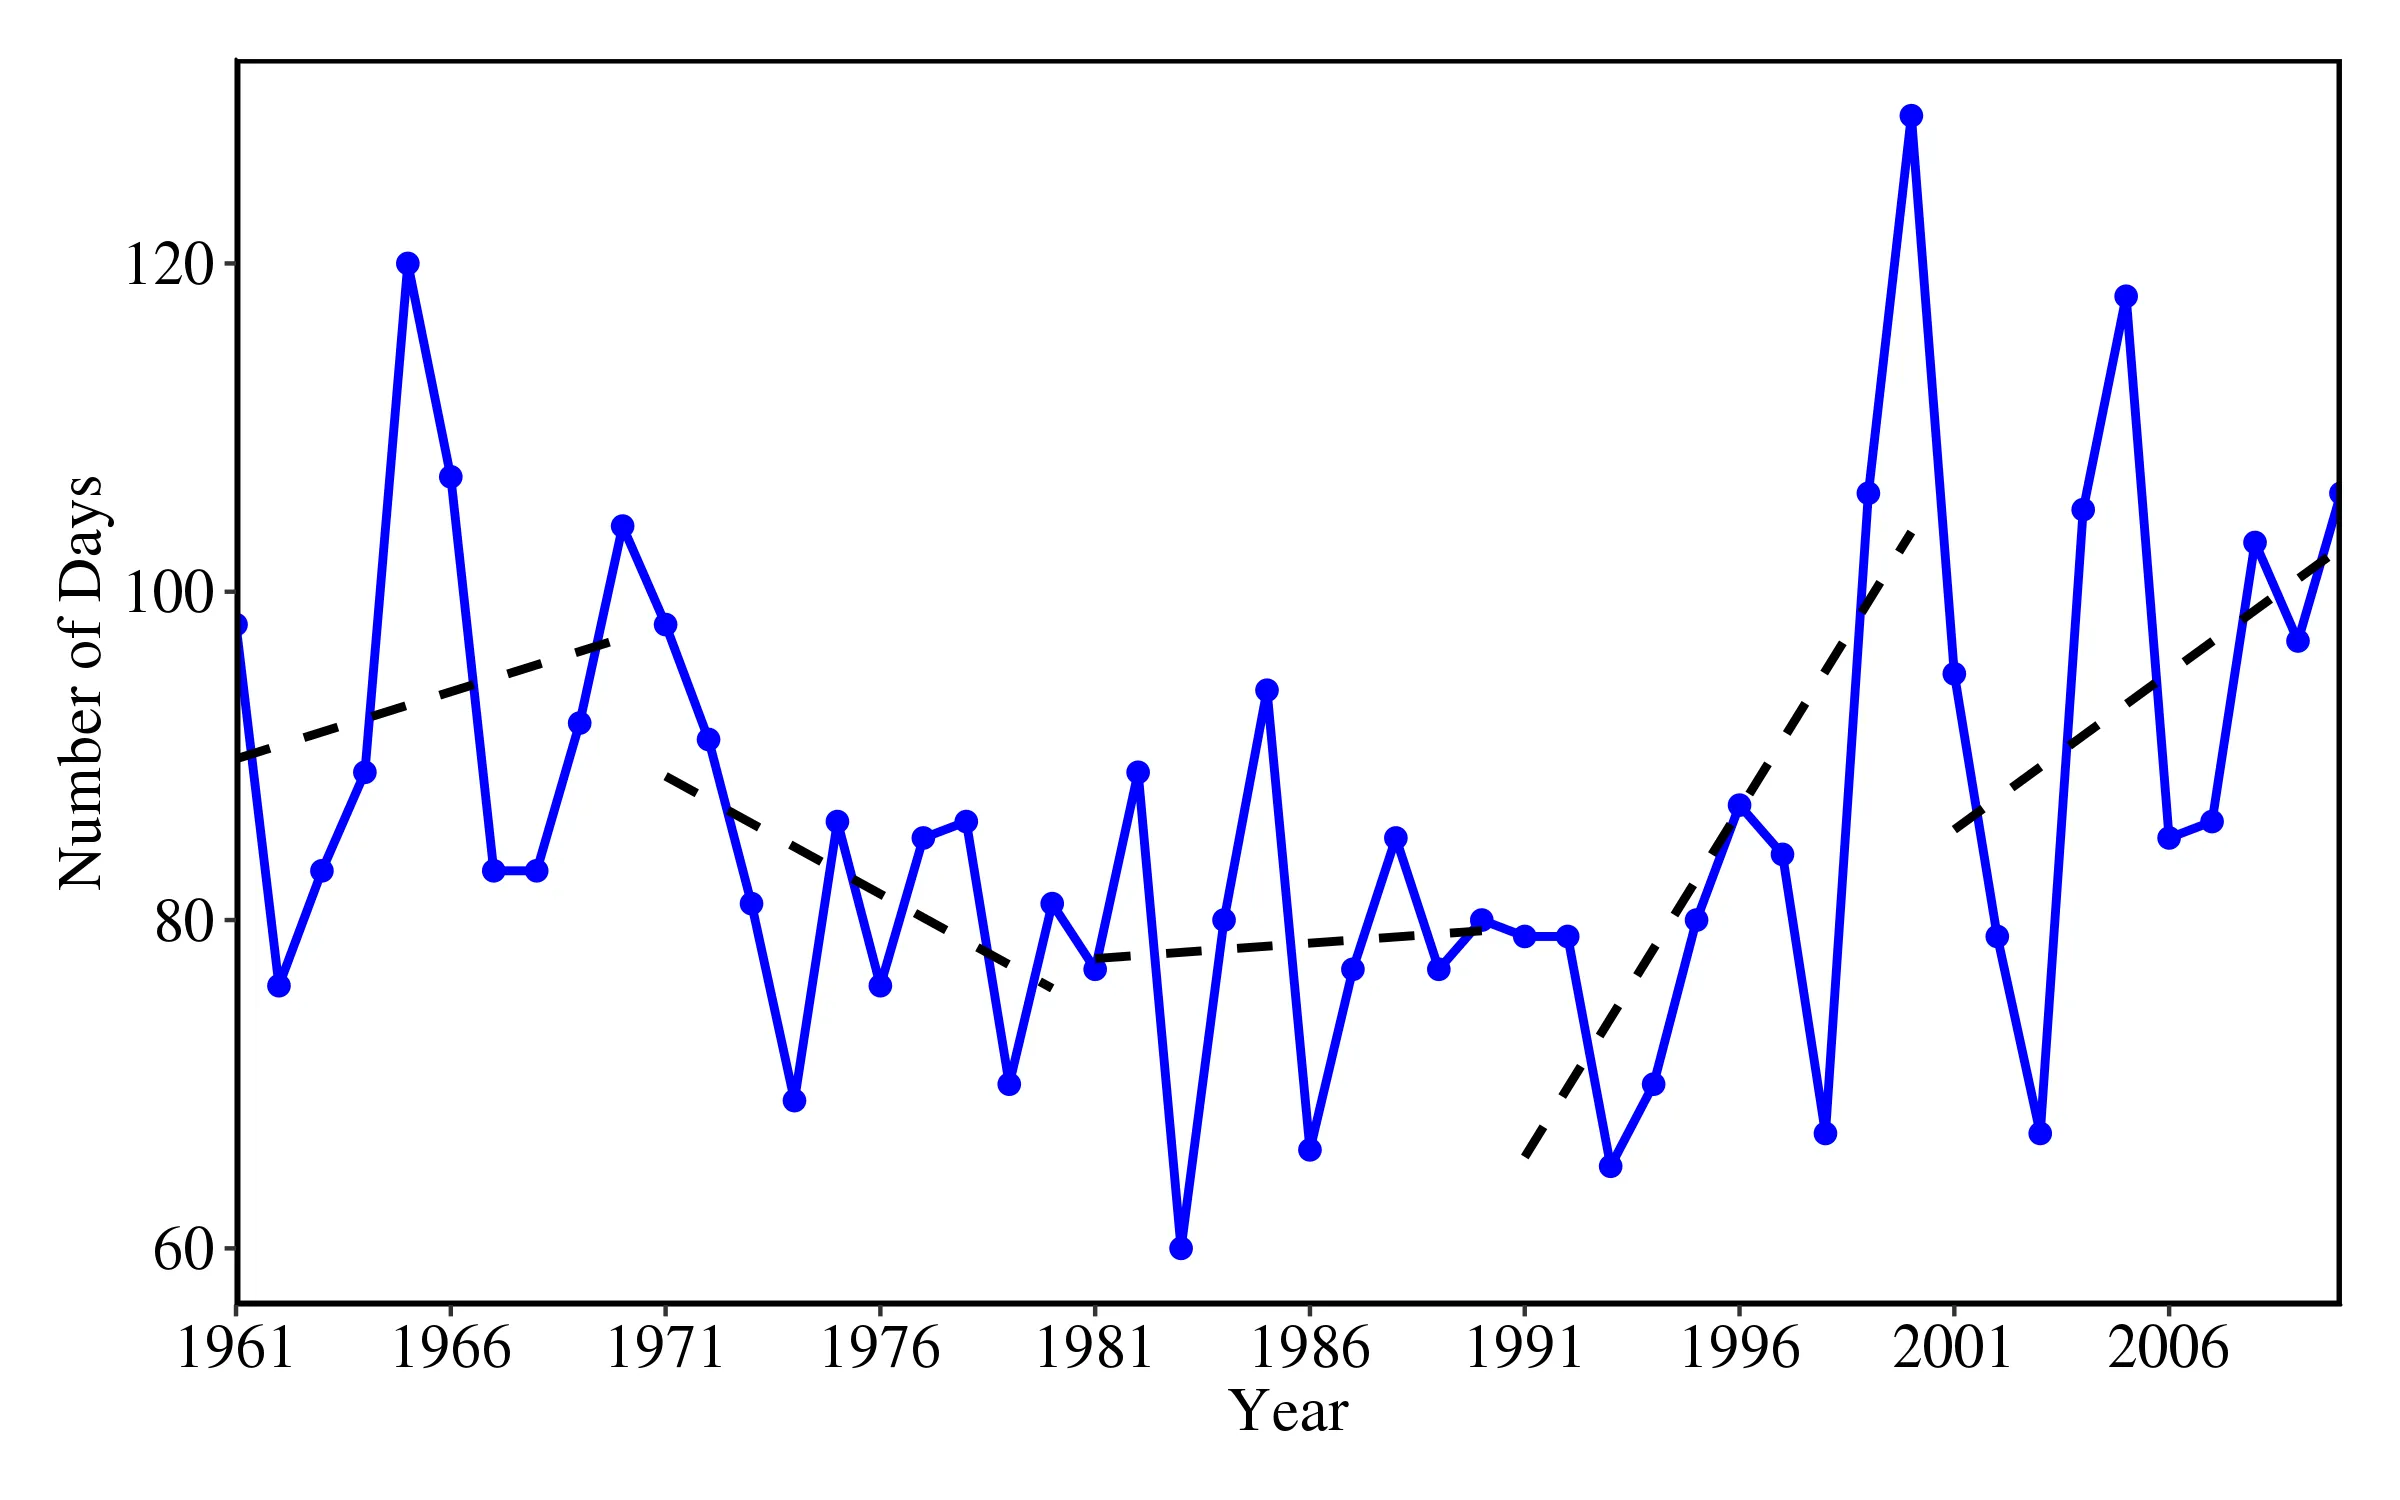
我的需求/问题
我想提取斜率并将其添加到图中的趋势线上。如何从geom_smooth()中提取每条线的斜率?
目前,我正在逐个绘制趋势线。我想知道是否有一种有效的方法可以进行可调节时间窗口的操作。例如,假设我想为每5年绘制一次趋势线。在上面的图中,时间窗口为10。
假设我仅想绘制显著的趋势线(即p值<0.05,null:无趋势或斜率为0),是否可以使用geom_smooth()实现这一点?
非常感谢您的帮助。
