是否有一种简单的方法可以像plotly散点图一样轻松地在plotly express折线图中添加趋势线?
我尝试使用下面的代码行创建我的数据框:
fig = px.line(df4, x=df4["DATE"], y=df4['Ratio'], title="Market Ratio", trendline='ols')
但是它会出现错误。
TypeError: line() got an unexpected keyword argument 'trendline'
感谢您!
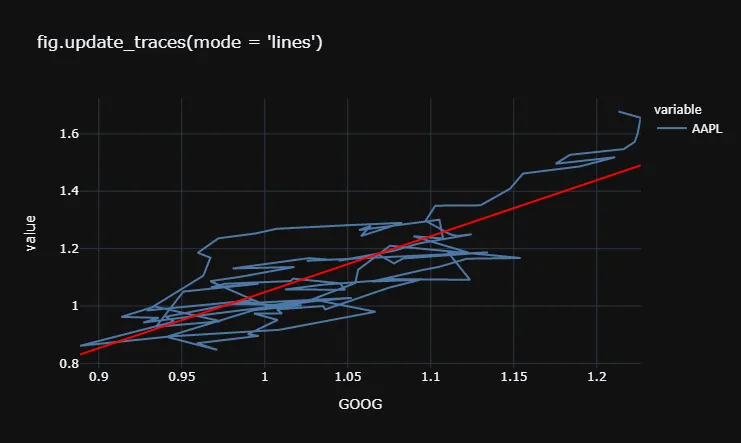
px.scatter以及:fig.update_traces(mode = 'lines')
如果px.line有trendline属性,那么这将产生与其相同的结果。
# imports
import pandas as pd
import plotly.express as px
import plotly.io as pio

# data
df = px.data.stocks()[['GOOG', 'AAPL']]

# your choices
target = 'GOOG'
colors = px.colors.qualitative.T10

# plotly
fig = px.scatter(df,
                 x = target,
                 y = [c for c in df.columns if c != target],
                 template = 'plotly_dark',
                 color_discrete_sequence = colors,
                 trendline = 'ols',
                 title = "fig.update_traces(mode = 'lines')")
f = fig.full_figure_for_development(warn=False)
fig.update_traces(mode = 'lines')
fig.data[-1].line.color = 'red'
fig.show()