Bokeh - 将颜色映射应用于一组线

3

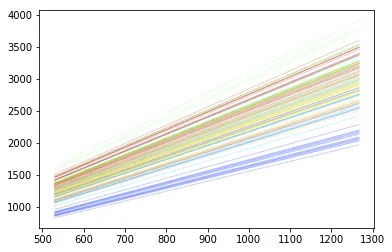
我有一段使用matplotlib绘制一系列线并应用颜色映射的代码。以下是代码摘录和结果:

cm = plt.cm.get_cmap('jet')
step = 15
xi = np.linspace(data[data.columns[0]].min(), data[data.columns[0]].max(), 2)
colors_l = np.linspace(0.1, 1, len(state_means[::step]))
for i, beta in enumerate(state_means[::step]):
    plt.plot(xi, beta[0] * xi + beta[1], alpha=.2, lw=1, c=cm(colors_l[i]))

使用matplotlib的输出

这里相关的代码部分是

c=cm(colors_l[i])

这段代码涉及plt.plot()函数,可以使用参数(此处为i)来索引颜色映射。

但是,如果我想使用bokeh的ColorMapper和line() glyph实现类似的效果,就会遇到错误。相关的代码行和输出如下:

call_color_mapper = LinearColorMapper(palette="Viridis256", low=min(call_strike_vals), high=max(call_strike_vals))
call_lines=dict()
call_chain_plot = figure(y_axis_label='Call OI', x_axis_label='Dates', x_axis_type = 'datetime')
for strike in call_strikes:
    call_lines[strike] = call_chain_plot.line('TIMESTAMP', strike, line_color=call_color_mapper(int(strike[2:])), source=callSource)

TypeError: 'LinearColorMapper' object is not callable

有没有一种方法可以使用颜色映射器在bokeh中对一组线状glyph进行着色?
2个回答

8
LinearColorMapper并不在Python中计算颜色。相反,LinearColorMapper表示发生在浏览器中JavaScript的颜色映射。如果您确实需要Python中的颜色,则必须手动进行映射,有很多方法可以做到这一点。
但是您可能不需要这样做,因此在Bokeh中执行此操作的最佳方法是使用multi_line而不是重复调用line。部分原因是出于性能考虑,Bokeh被优化为在“矢量化”操作上表现最佳。但是,它还允许您使用linear_cmap方便函数为任何数据列制作颜色映射器。以下是一个完整的示例:
from bokeh.io import output_file, show
from bokeh.models import ColumnDataSource
from bokeh.plotting import figure
from bokeh.transform import linear_cmap

output_file("cmap.html")

p = figure()

source = ColumnDataSource(data=dict(
    xs=[[0,1] for i in range(256)],     # x coords for each line (list of lists)
    ys=[[i, i+10] for i in range(256)], # y coords for each line (list of lists)
    foo=list(range(256))                # data to use for colormapping
))

p.multi_line('xs', 'ys', source=source,
             color=linear_cmap('foo', "Viridis256", 0, 255))

show(p)

enter image description here


这是一个很好的解决方案!然而,通过循环逐行添加而不是使用单个multi_line函数的原因是能够检索每个单独行的句柄。稍后将使用该句柄来显示一些线在次要甚至第三个y轴上的轴。是否有办法在line()中使用linear_cmap? - Parikshit Bhinde

2
虽然 @bigreddot 的解决方案提供了使用 linear_cmap() 绘制一组线条的很好的替代 line() 图元的方法,但它无法提供捕获单个线条句柄的方法,如果需要进一步处理这些句柄(例如为其中一些绘制辅助 y 轴),就会出现问题。这就是我在原始帖子中将每条线的句柄收集到字典中的原因。
另一种通过循环列表逐个绘制线条的方法如下:
from bokeh.palettes import viridis #here viridis is a function that takes\
#parameter n and provides a palette with n equally(almost) spaced colors.

call_colors = viridis(len(call_strikes))
color_key_value_pairs = list(zip(call_strikes, call_colors))
color_dict = dict(color_key_value_pairs)

现在,可以使用字典color_dict根据字典中的值来访问颜色。因此,我按照原帖中的代码运行如下:
call_lines=dict()
for index, strike in enumerate(call_strikes):
call_lines[strike] = call_chain_plot.line('xs', strike, color=color_dict[strike], source=callSource)

我想当@bigreddot写道,“如果你真的需要在Python中使用颜色,你就必须手动映射它们,有很多方法可以做到这一点。” 这就是他所指的。

网页内容由stack overflow 提供, 点击上面的
可以查看英文原文,
原文链接