在Cartopy中创建陆地/海洋掩模?

3
我有一个带有相关纬度/经度的网格数据数组,我想使用Cartopy查找每个特定网格单元格是在海洋还是陆地上。
我可以简单地从Cartopy Feature接口获取陆地数据。
land_10m = cartopy.feature.NaturalEarthFeature('physical', 'land', '10m')

我可以获得几何信息

all_geometries = [geometry for geometry in land_50m.geometries()]

但我无法弄清如何使用这些几何图形来测试特定位置是否在陆地上。
这个问题似乎以前就出现过使用Cartopy从数据中掩盖海洋或陆地,解决方案基本上是“改用basemap”,这有点不令人满意。
======== 更新 ========
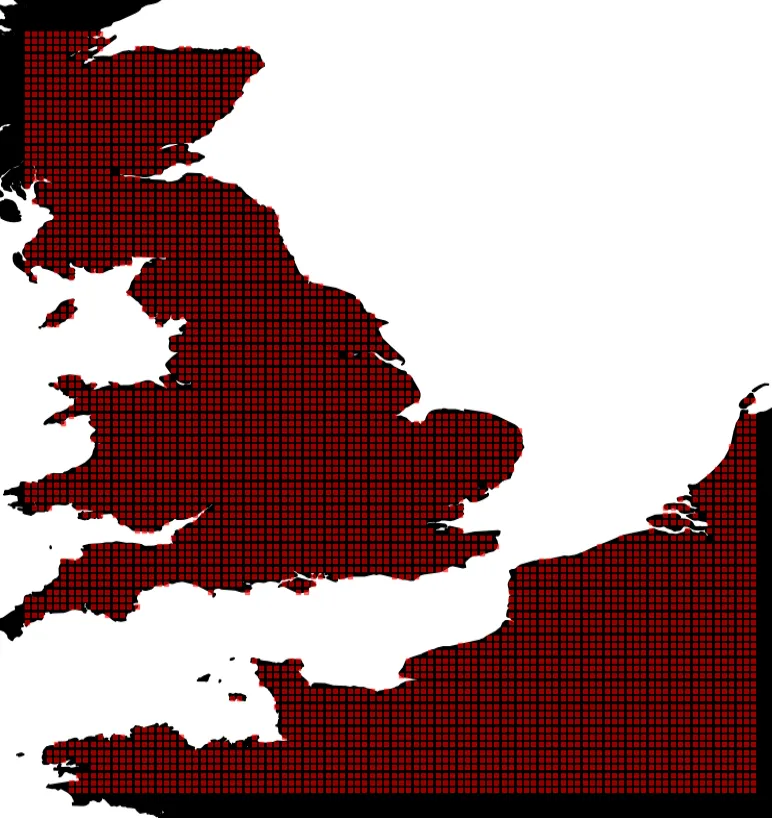
感谢bjlittle,我有了一个可行的解决方案,并生成了下面的绘图。
from IPython import embed
import numpy as np
import matplotlib.pyplot as plt
import cartopy.crs as ccrs
import cartopy.io.shapereader as shpreader
from shapely.geometry import Point
import cartopy

land_10m = cartopy.feature.NaturalEarthFeature('physical', 'land', '10m')
land_polygons = list(land_10m.geometries())

lats = np.arange(48,58, 0.1)
lons = np.arange(-5,5, 0.1)
lon_grid, lat_grid = np.meshgrid(lons, lats)

points = [Point(point) for point in zip(lon_grid.ravel(), lat_grid.ravel())]

land = []
for land_polygon in land_polygons:
    land.extend([tuple(point.coords)[0] for point in filter(land_polygon.covers, points)])

fig = plt.figure(figsize=(8, 8))
ax = fig.add_axes([0, 0, 1, 1], projection=ccrs.PlateCarree())

ax.add_feature(land_10m, zorder=0, edgecolor='black',     facecolor=sns.xkcd_rgb['black'])

xs, ys = zip(*land)
ax.scatter(xs, ys, transform=ccrs.PlateCarree(),
       s=12, marker='s', c='red', alpha=0.5, zorder=2)

plt.show()

Land mask

然而,这种方法非常缓慢,最终我需要在更高的分辨率下进行全局操作。

有人有什么建议可以使上述方法更快吗?

==== 更新2 ====

准备多边形会有很大的改善作用。

添加这两行代码将把一个1度的示例从40秒加速到0.3秒。

from shapely.prepared import prep
land_polygons_prep = [prep(land_polygon) for land_polygon in land_polygons]

我之前运行的例子在0.1度下运行了半个多小时(也就是在午饭时间运行),现在只需要1.3秒就能完成 :-)

2个回答

4
以下是使用上述解决方案解决此问题的代码示例:
from IPython import embed
import numpy as np
import matplotlib.pyplot as plt
import cartopy.crs as ccrs
import cartopy.io.shapereader as shpreader
from shapely.geometry import Point
import cartopy
from shapely.prepared import prep
import seaborn as sns


land_10m = cartopy.feature.NaturalEarthFeature('physical', 'land', '10m')
land_polygons = list(land_10m.geometries())

lats = np.arange(48,58, 0.1)
lons = np.arange(-5,5, 0.1)
lon_grid, lat_grid = np.meshgrid(lons, lats)

points = [Point(point) for point in zip(lon_grid.ravel(), lat_grid.ravel())]


land_polygons_prep = [prep(land_polygon) for land_polygon in land_polygons]


land = []
for land_polygon in land_polygons_prep:
    land.extend([tuple(point.coords)[0] for point in filter(land_polygon.covers, points)])

fig = plt.figure(figsize=(8, 8))
ax = fig.add_axes([0, 0, 1, 1], projection=ccrs.PlateCarree())

ax.add_feature(land_10m, zorder=0, edgecolor='black', facecolor=sns.xkcd_rgb['black'])

xs, ys = zip(*land)
ax.scatter(xs, ys, transform=ccrs.PlateCarree(),
       s=12, marker='s', c='red', alpha=0.5, zorder=2)

不幸的是,这种方法在高分辨率数据下需要很长时间。我刚刚发布了以下答案,描述如何根据光栅化地图轻松创建实际掩码:https://dev59.com/BZXfa4cB1Zd3GeqPl-uh#73763018 - Pontis

3
为了突出一种可能的方法,我基于优秀的Cartopy Hurricane Katrina (2005)画廊示例进行了回答,该示例绘制了卡特里娜飓风在墨西哥湾横扫并越过美国时的路径。
通过简单地使用cartopy.io.shapereader和一些shapely predicates的混合,我们可以完成任务。我的示例有点冗长,但不要被吓到...它并不可怕。
import matplotlib.pyplot as plt
import shapely.geometry as sgeom

import cartopy.crs as ccrs
import cartopy.io.shapereader as shpreader


def sample_data():
    """
    Return a list of latitudes and a list of longitudes (lons, lats)
    for Hurricane Katrina (2005).

    The data was originally sourced from the HURDAT2 dataset from AOML/NOAA:
    http://www.aoml.noaa.gov/hrd/hurdat/newhurdat-all.html on 14th Dec 2012.

    """
    lons = [-75.1, -75.7, -76.2, -76.5, -76.9, -77.7, -78.4, -79.0,
            -79.6, -80.1, -80.3, -81.3, -82.0, -82.6, -83.3, -84.0,
            -84.7, -85.3, -85.9, -86.7, -87.7, -88.6, -89.2, -89.6,
            -89.6, -89.6, -89.6, -89.6, -89.1, -88.6, -88.0, -87.0,
            -85.3, -82.9]

    lats = [23.1, 23.4, 23.8, 24.5, 25.4, 26.0, 26.1, 26.2, 26.2, 26.0,
            25.9, 25.4, 25.1, 24.9, 24.6, 24.4, 24.4, 24.5, 24.8, 25.2,
            25.7, 26.3, 27.2, 28.2, 29.3, 29.5, 30.2, 31.1, 32.6, 34.1,
            35.6, 37.0, 38.6, 40.1]

    return lons, lats


# create the figure and geoaxes
fig = plt.figure(figsize=(14, 12))
ax = fig.add_axes([0, 0, 1, 1], projection=ccrs.LambertConformal())
ax.set_extent([-125, -66.5, 20, 50], ccrs.Geodetic())

# load the shapefile geometries
shapename = 'admin_1_states_provinces_lakes_shp'
states_shp = shpreader.natural_earth(resolution='110m',
                                     category='cultural', name=shapename)
states = list(shpreader.Reader(states_shp).geometries())

# get the storm track lons and lats
lons, lats = sample_data()

# to get the effect of having just the states without a map "background"
# turn off the outline and background patches
ax.background_patch.set_visible(False)
ax.outline_patch.set_visible(False)

# turn the lons and lats into a shapely LineString
track = sgeom.LineString(zip(lons, lats))

# turn the lons and lats into shapely Points
points = [sgeom.Point(point) for point in zip(lons, lats)]

# determine the storm track points that fall on land
land = []
for state in states:
    land.extend([tuple(point.coords)[0] for point in filter(state.covers, points)])

# determine the storm track points that fall on sea
sea = set([tuple(point.coords)[0] for point in points]) - set(land)

# plot the state polygons
facecolor = [0.9375, 0.9375, 0.859375]    
for state in states:
    ax.add_geometries([state], ccrs.PlateCarree(),
                      facecolor=facecolor, edgecolor='black', zorder=1)

# plot the storm track land points 
xs, ys = zip(*land)
ax.scatter(xs, ys, transform=ccrs.PlateCarree(),
           s=100, marker='s', c='green', alpha=0.5, zorder=2)

# plot the storm track sea points
xs, ys = zip(*sea)
ax.scatter(xs, ys, transform=ccrs.PlateCarree(),
           s=100, marker='x', c='blue', alpha=0.5, zorder=2)

# plot the storm track
ax.add_geometries([track], ccrs.PlateCarree(),
                  facecolor='none', edgecolor='k')

plt.show()

上述示例应该生成以下绘图,其中突出了如何使用Shapely几何体区分陆地和海洋点。
希望对你有所帮助。

“covers”似乎没有任何文档记录。如果有的话,您能指向它或解释一下它的作用吗?(与intersects等相比) - Rob
不错,Rob。是的,如果你要迭代许多几何图形,那么每次都采用准备好的几何选项...正如你发现的那样,它可以大大优化运行时。准备好的几何图形唯一的缺点是功能不够丰富,但显然对于你的用例来说这没问题。顺便提一下,这里是准备和覆盖的链接,参见 https://shapely.readthedocs.io/en/stable/manual.html#prepared-geometry-operations - bjlittle
谢谢。但是,该链接只是说:“准备好的几何实例具有以下方法:包含、包含适当、覆盖和相交。所有这些方法都与非准备好的几何对象中的对应方法具有完全相同的参数和用法。” 它似乎没有定义覆盖等实际上是什么(无论是准备好的还是非准备好的)。 - Rob

网页内容由stack overflow 提供, 点击上面的
可以查看英文原文,
原文链接